Ascending Triangle Chart Pattern
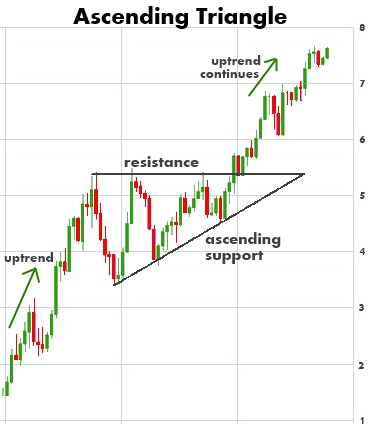
The Ascending triangle is a trend continuation pattern typically formed in an uptrend that serves for existing direction confirmation.
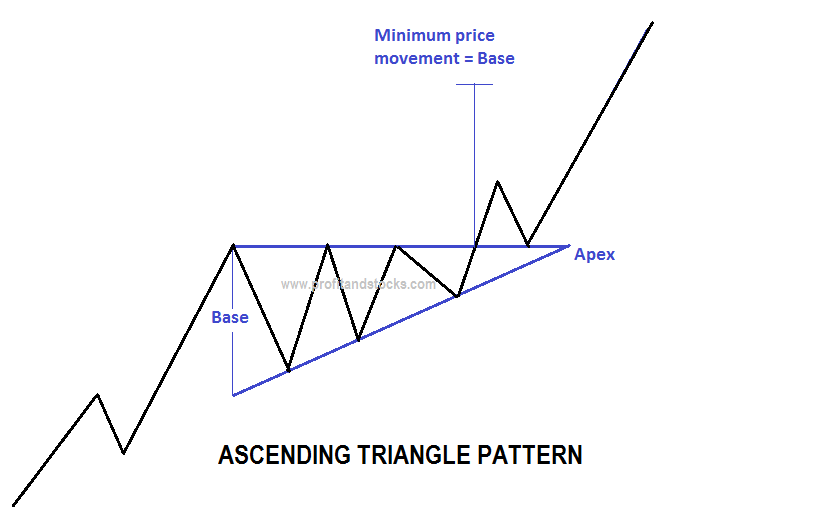
This pattern is represented by a narrowing price range between high and low prices, visually forming a triangle. The main distinctive feature of this type of triangles is that it generally has a horizontal trend line (resistance) connecting the highs at roughly the same level and an ascending trend line (support) connecting higher and higher lows.When the price breaks above the resistance line (plus certain deviation is possible), usually somewhere between halfway and three-quarters of the way through the pattern, a buy signal is received.