SUPPORT AND RESISTANCE
The troughs, or reaction lows, are called support. The term is self-explanatory and indicates that support is a level or area on the chart under the market where buying interest is sufficiently strong to overcome selling pressure.
Resistance is the opposite of support and represents a price level or area over the market where selling pressure overcomes buying pressure and a price advance is turned back.
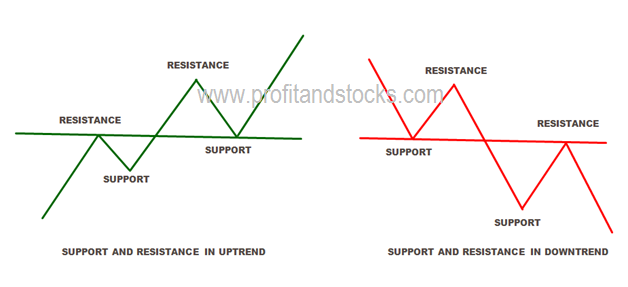
In an uptrend, the resistance levels represent pauses in that uptrend and are usually exceeded at some point. In a downtrend, support levels are not sufficient to stop the decline permanently, but are able to check it at least temporarily. A solid grasp of the concepts of support and resistance is necessary for a full understanding of the concept of trend. For an uptrend to continue, each successive low (support level) must be higher than or equal to the one preceding it. Each rally high (resistance level) must be higher than or equal to the one before it. If the support level is violated, then a trend reversal from up to down is likely. Failure to exceed a previous peak in an uptrend, or the ability of prices to bounce off the previous support low in a downtrend, is usually the first warning that the existing trend is changing.
PSYCHOLOGY OF SUPPORT AND RESISTANCE
Let’s assume that a market starts to move higher from a support area (A) where prices have been fluctuating for some time. The longs (those who bought near the support area) are delighted, but regret not having bought more. If the market would dip back near that support area again, they could add to their long positions. The shorts (who sold at X due to pullback in downtrend) now realize that they are on the wrong side of the market. The shorts are hoping (and praying) for a dip back to that area(C) where they went short so they can get out of the market where they got in (their break-even point).Those sitting on the side lines can be divided into two groups—those who never had a position and those who, for one reason or another, liquidated previously held long positions at the minor resistance area (equal to point X).The latter group are, of course, mad at themselves for liquidating their longs prematurely and are hoping for another chance to re-initiate those longs near C where they sold them.The final group, the undecided, now realize that prices are going higher and resolve to enter the market on the long side on the next good buying opportunity (say at C). All four groups are resolved to “Buy the next dip.” They all have a “vested interest” in that support area under the market. Naturally, if prices do decline near that support(C), renewed buying by all four groups will materialize to push prices up.

SUPPORT BECOMING RESISTANCE AND VICE VERSA
Degree of Penetration
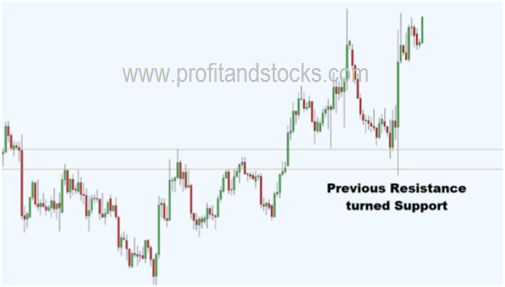
A support level, penetrated by a significant margin, becomes a resistance level and vice versa. It’s important to remember, however, that support and resistance areas only reverse roles when the market moves far enough away to convince the market participants that they have made a mistake. The farther away the market moves, the more convinced they become.
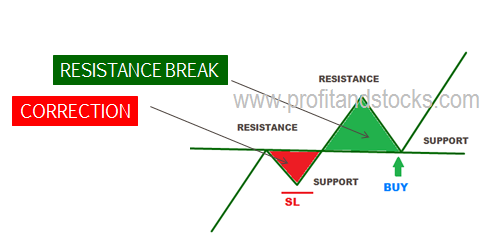
What constitutes significant margin?
As per my experience any break of support or resistance must be greater than or equal to the correction just before the break in terms of magnitude and at least there must be sustainability of five consecutive closing candles after break in terms of magnitude. I consider this criteria based on my
-own market experience however many books defines significant margin as three percent for daily chat, one percent for intraday chart on closing basis.
TYPES OF SUPPORT AND RESISTANCE
As explained is definition of trend, markets don’t generally move in a straight line in any direction. Market moves are characterized by a series of zigzags. These zigzags resemble a series of successive peaks and troughs and it is those peaks and troughs which forms the support and resistance in the market. Sometime these support and resistance are easily seen on the chart and moves in structured manner but sometimes their behaviour are unstructured. It is those unstructured support and resistance where traders are not able to take decision about market.
There are four types of structured support-resistance in the market……
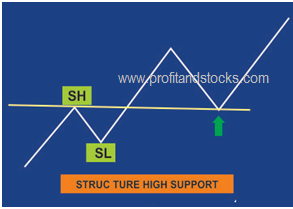
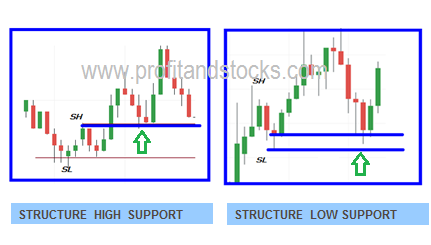
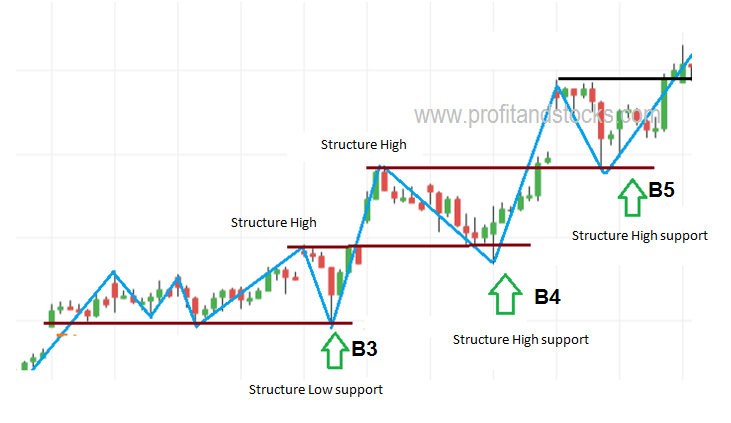
Structure high support
As discussed earlier, resistance level, penetrated by a significant margin, becomes a support level and vice versa. So what constitutes significant margin?Any break of resistance must be greater than or equal to the correction just before the break in terms of magnitude and at least there must be sustainability of five consecutive closing candle after break in terms of duration. If this occurs then market likely to take support at previous high.
Structure low support
If resistance is not broken by significant margin as stated above in case of structured support then previous support is only becomes the area for buyers and acts as support.

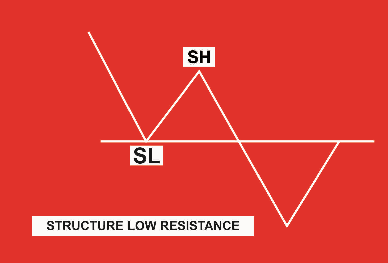
Structure low resistance
Any break of support must be greater than or equal to the correction just before the break in terms of magnitude and at least there must be sustainability of five consecutive closing candle after break in terms of duration. If this occurs then market likely to take resistance at previous low.
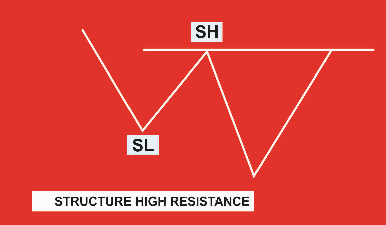
Structure high resistance
If support is not broken by significant margin as stated above in case of structured support then previous resistance is only becomes the area for sellers and acts as resistance.
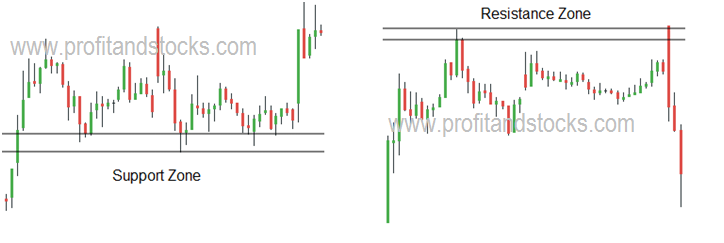
SUPPORT AND RESISTANCE IS A ZONE NOT A POINT
As discussed above in definition of support and resistance, support is an area on the chart under the market where buying interest is sufficiently strong enough to overcome selling pressure and resistance is the area over the chart where selling pressure overcomes buying pressure and a price advance is turned back. So it must be noted from the above definition that support or resistance shall never be misunderstood by a specific point or price instead it must be marked and identified as zone on the chart. Let’s see how to draw support and resistance on chart…….
For drawing support on chart, two points are taken into consideration to make a zone or area. First point should be lowest low and second point should be nearest close. For a bullish green candle the closing is at top of body and for bearish red candle closing is at the bottom of body.
Let’s look at following examples…….For drawing support lowest low and nearest close has been considered and for drawing resistance highest high and nearest close has been considered.