MOVING AVERAGES-SIMPLE AND EXPONENTIAL
Moving averages smooth the price data to form a trend following indicator. They do not predict price direction, but rather define the current direction with a lag Moving averages lag because they are based on past prices. Despite this lag moving averages help smooth price action and filter out the noise. The two most popular types of moving averages are the Simple Moving Average (SMA) and the Exponential Moving Average (EMA). The same signals can be generated using simple or exponential moving averages. The preference depends on each individual. Though there are dozens of moving averages but the most common moving averages used by technical analysts is simple moving average and exponential moving average.
Calculation

Moving averages period setting
There are no standard period settings for Moving average period. Use of any moving average period will provide similar result. However Select average which is fit for present market which is not showing too much bad signals For example both 20 day moving average and 30 day moving average will provide similar results but will give buy/sell signal at slightly different time The key is to stick to one MA otherwise your trade can get messed up.
Generally it is preferable to stick to 10, 20, 50 and 200 days moving averages for single use as they are used by lots of big investors and traders. However for double crossover it is recommended to use (5. 20) for intraday trading, (10.50) for positional trading, and (50,200) for investment purpose to generate buy sell signal. Two moving averages are selected by traders, one larger for big trend identification and one short for trading signal generation.
Use of Moving Average – Simple and Exponential
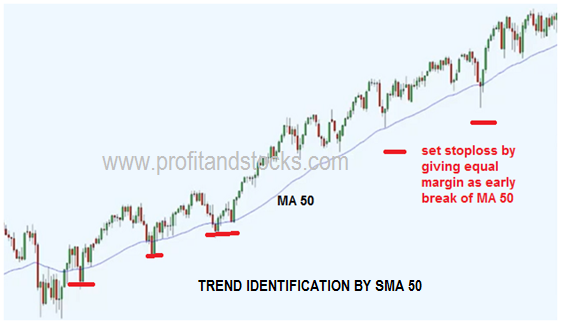
Trend Identification
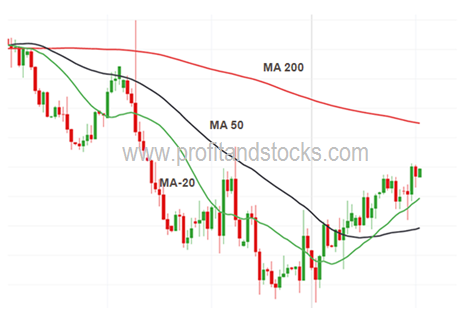
The direction of the moving average conveys important information about prices A rising moving average shows that prices are generally increasing A falling moving average indicates that prices, on average are falling A rising long-term moving average reflects a long-term uptrend A faring long-term moving average reflects a long-term downtrend.
Crossover
Crossover is used for generating buys and sell signal using two moving averages (may be three or four) when three conditions are met For example using two moving average a buy signal is generated when
- Both average turns in the direction of price then
- Bullish Crossover of two averages takes place
- Price moves above both the average
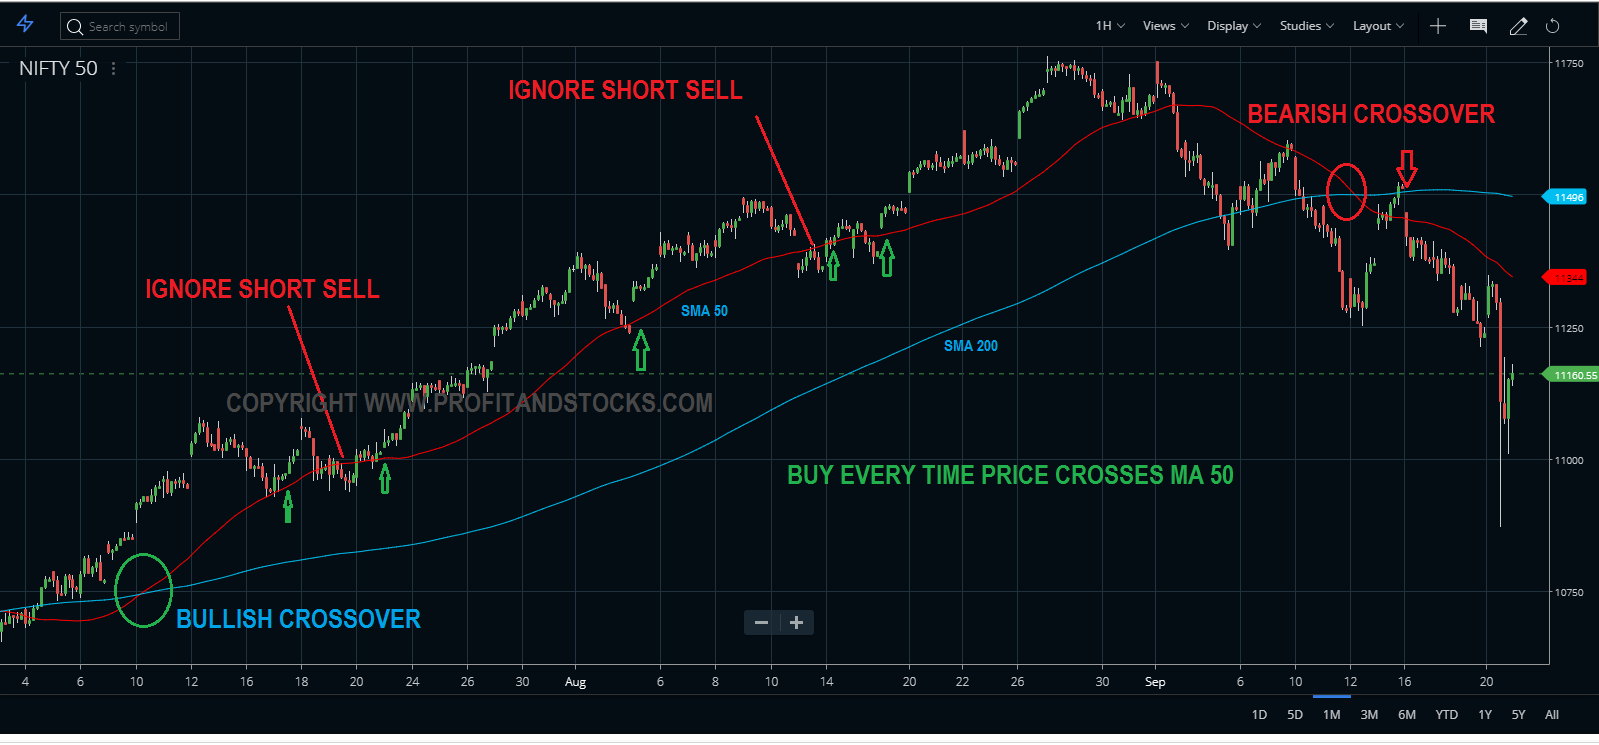
For example, if price is above the 200-day moving average, chartists would only focus on signals when price moves above the 50-day moving average. Obviously, a move below the 50-day moving average would precede such a signal. But such bearish crosses would be ignored because the bigger trend is up. A bearish cross would simply suggest a pullback within a bigger uptrend. A cross back above the 50-day moving average would signal an upturn in prices and continuation of the bigger uptrend.
Support and Resistance
Moving averages can also act as support in an uptrend and resistance in a downtrend. A short-term uptrend market finds support near the 20-day simple moving average.In above chart SMA 50 acts as support and resistance.