Rectangle Chart Pattern Pattern
It is also known as Neutral Channel pattern, It consist of two trend line parallel to each other having points forming equal highs al id equal lows, thus forming a rectangular or box shape The price is confined between the two trend lines It consist of the following.
- Horizontal tipper Trend line: Also known as the main trend line or primary trend line It is called so because it is the one which determines the trend It should have at least two consecutive points forming equal highs. More point is the indication of more strength in the pattern. The main trend line acts as a resistance in descending Channel pattern.
- Horizontal Lower Trend line: Also known as the channel line or secondary trend line. This is drawn in parallel to the main trend line It serves as a support in this pattern. It should also have a minimum of 2 consecutive equal lows point. More points indicate more strength in the pattern. This pattern is formed when there is a tough competition between this bulls and the bears, nobody is ready to give up resulting in equal highs and equal lows. That is why this pattern is also known as consolidation zones.


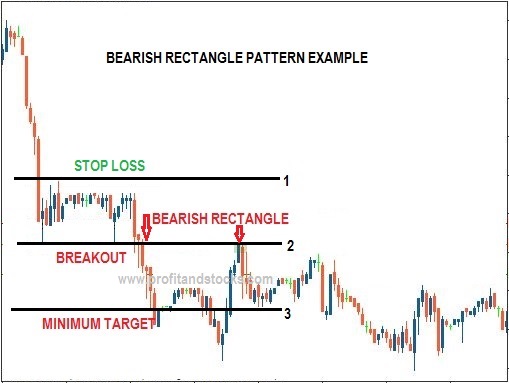
Breakout: It can occur in any direction upside or downside If the breakout is in upside direction, it indicates that the bulls have taken over bears and indicates a buy signal, However if the breakout is in downside direction it indicates selling pressure or victory of bears over bulls and indicates a sell signal.
Volume: For a rectangular channel pattern there is no such standard trend for the volume. It can be increasing, decreasing, neutral or high then low or vice versa. However there is a increase in volume with an upside breakout and there is an decrease in volume with a downside breakdown.
Minimum Price Target: One can roughly put a price target after a breakout, and it should be the height of the channel etc. In the case of upside breakdown.One can put the price target upwards and can put downwards in case of downside breakout.