CONCEPT OF TREND
Definition of Trend
In a general sense, the trend is simply the direction of the market, which way it’s moving. First of all, markets don’t generally move in a straight line in any direction. Market moves are characterized by a series of zigzags. These zigzags resemble a series of successive waves with fairly obvious peaks and troughs. It is the direction of those peaks and troughs that constitutes market trend. Whether those peaks and troughs are moving up, down, or sideways tell us the trend of the market.
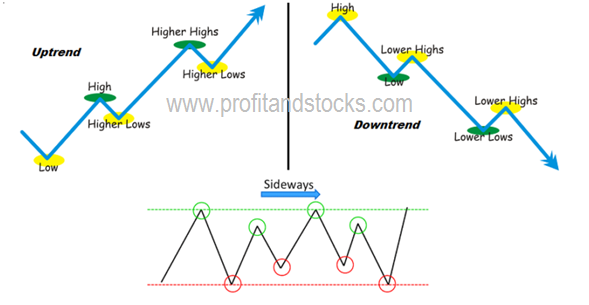
An uptrend would be defined as a series of successively higher peaks and troughs; a downtrend is just the opposite, a series of declining peaks and troughs; horizontal peaks and troughs would identify a sideways price trend.
A major or primary trend is considered the main trend over a longer period of time. This is the dominant direction of a market movement.Within the major trend we can also have a secondary trend.Smaller movements which tend to last for very short periods of time are referred to as minor trends.
Most technical tools and systems are trend-following in nature, which means that they are primarily designed for markets that are moving up or down. They usually work very poorly, or not at all, when markets enter these lateral or “trendless” phases. It is during these periods of sideways market movement that technical traders experience their greatest frustration and systems traders their greatest equity losses.
When a market is rising, the buying strategy is preferable. When it is falling, the second approach would be correct. However, when the market is moving sideways, the third choice— to stay out of the market—is usually the wisest.
How to trade with trends
If a market has been bullish and heading higher followed by a move lower and then resumes its original direction, the move lower is the secondary trend whilst the move higher is the primary trend.Minor trends typically last a very short period of time compared to the secondary trend. It is the minor trends where day traders attempt to capture smaller micro movements.Therefore, from a time perspective, longer term traders look for primary trends to capture larger moves ranging from weeks to months. Intermediate term traders seek to capture secondary trends lasting from days to weeks and short term traders tend to look at minor trends ranging from hours to days.
When entering a trade it is important to know which direction the markets are currently trading in to offer a higher probability of successful trades. It is easy to think that being on the right side of the market should yield good results and although this sounds simple it can be difficult – especially for beginners – to enter a trade at the wrong phase of a trend.
Trend lines
One of the simplest tools to determine the direction of a market is trend lines.Once you have a chart in place, to recognise if a market is in an uptrend or downtrend the use of trend lines can be applied.A trend line is a sloppy line drawn on the chart which represents the speed of the market. Lesser the degree of slope, higher will be speed and vice versa. Chartists define trends on charts by drawing trend lines at angles. As mentioned earlier, there are three types of trends: uptrend, downtrend and sideways.When the market is moving up or in an uptrend, the trend line will have a rising slope. This is achieved by joining two low points of a chart. The second low must be higher than the first low.In a downtrend, the trend line would have a negative slope. By joining two highs together where the second high must be lower than the first high we would have a falling market.At times when markets are stuck within a range we can also apply trend lines to both the highs and lows. This would create a channel and the market would appear to be stuck within a box.Reader should keep in mind that break of speed line does not indicate trend reversal and has nothing to do with change in trend. It only indicates slowdown in speed of market.
How to draw Trend lines?
Once two significant ascending lows have been identified, a straight line is drawn connecting the lows and projected up and to the right. Some chartists require that the peak at point 2 be penetrated to confirm the uptrend before drawing the trend line. Others only require a 50% retracement of wave 2-3, and some looks for prices approaching the top of wave 2.
While the criteria may differ, the main point to remember is that the chartist wants to be reasonably sure that a reaction low has been formed before identifying a valid reaction low.

How to Use the Trend line?
In an uptrend, the inevitable corrective dip will often touch or come very close to the uptrend line. Because the intent of the trader is to buy dips in an uptrend that trend line provides a support boundary under the market that can be used as a buying area. A down trend line can be used as a resistance area for selling purposes. As long as the speed line is not violated; it can be used to determine buying and selling areas. However, at point 1 in Figures the violation of the speed line signals a speed change, calling for liquidation of all positions in the direction of the previous trend. Then a new speed line is drawn with new low until previous low is not broken. Very often, the breaking of the speed line is one of the best early warnings of a change in trend and that is further confirmed with Dow principle.When point 2 is broken then a change in trend from up to down is confirmed.

HOW TO IDENTIFY CHANGE IN TREND
Dow Theory of trend: A Trend is assumed to be in Effect until It Gives Definite Signals That It Has Reversed.
Any real change in trend do not in a day or week.The entire trend-following approach is predicated on riding an existing trend until it shows signs of reversing. Because the universe of futures markets is still quite small, the potential for these systems distorting short term price action is growing. However, even in cases where distortions do occur, they are generally short term in nature and do not cause major moves or reversal in trend. Most people generally don’t understand the difference between a normal secondary correction in an existing trend and the first leg of a new trend in the opposite direction.
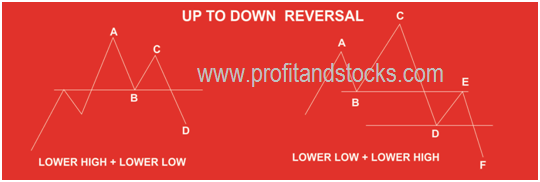
Figure A:Trend reversal from up to down

Figure A:Trend reversal from down to up
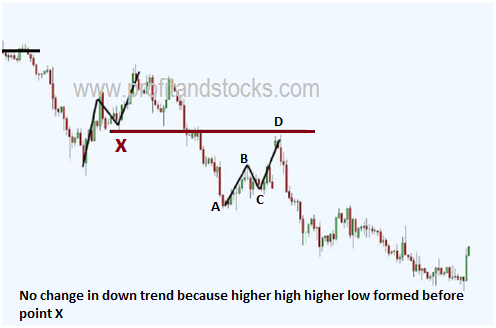
Look at the figure A,Here price first made lower high then breaks the low to make lower low,so break of point B constitutes a change in trend from up to down.In case of figure B price first made lower low.This occurrence of break of support at point B is very often but do not cause any change in trend as there is absence of lower high in this case.However when point D is broken after formation of lower high at E then this constitutes a change in trend from up to down.However it must be noted that whether it is figure A or figure B ,there is no significance of lower high-lower low or lower low-lower high before point X.Except this all down move in existing trend can be treated as correction only and one can look to buy corrections in uptrend without having second guess.
Channel Lines
The Channel Line is another useful variation of the speed line technique. Sometimes price trends between two parallel lines-The basic trend line and the channel line. The channel line can be upward slopping, downward slopping or flat. The drawing of the channel line is relatively simple.
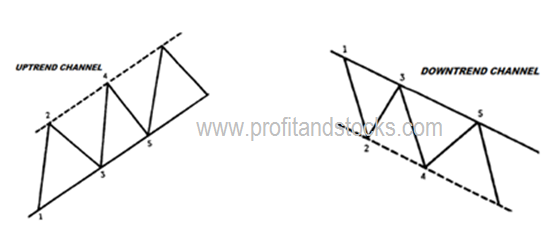
In an uptrend first draw the basic uptrend speed line along the lows, then draw another line parallel to basic uptrend speed line from peak (2).Both line move up to the right, forming a channel. If next rally reaches and backs off from the channel line (4), then a channel may exist. If price then drop back to the original trend line (5), then channel probably does exist. The same holds true for a downtrend direction.
- Initiate new long position at basic up trend line and book profit at channel line but do not go short at channel line in up trending channel.
- Initiate new short position at basic down trend line and book profit at down channel line but do not go long at channel line in down trending channel.
