Search for:
Cart 0
  • Home
  • Learn To Trade
  • Technical Analysis
    • Introduction
    • Understanding Candlesticks
    • Concept of Trend
    • Support and Resistance
    • Chart Patterns
      • Overview
      • Reversal Patterns
        • Head and Shoulders Chart Pattern
        • Double Top Chart Pattern
        • Double Bottom Chart Pattern
        • Triple Top Chart Pattern
        • Triple Bottom Chart Pattern
      • Continuation Patterns
        • Symmetrical Triangle Chart Pattern
        • Ascending Triangle Chart Pattern
        • Descending Triangle Chart Pattern
        • Rectangle Chart Pattern Pattern
        • Flag and Pennants Chart Pattern
    • Harmonic Patterns
    • Technical Indicators
      • Moving Average SMA and EMA
      • Bollinger Band Indicator
      • Relative Strength Index (RSI)
  • Blog
  • Connect
    • Contact
    • You Tube
  • phone (+91) 9560531632
  • email Profitandstocks@gmail.com
0
Profit and Stocks
  • Home
  • Learn To Trade
  • Technical Analysis
    • Introduction
    • Understanding Candlesticks
    • Concept of Trend
    • Support and Resistance
    • Chart Patterns
      • Overview
      • Reversal Patterns
        • Head and Shoulders Chart Pattern
        • Double Top Chart Pattern
        • Double Bottom Chart Pattern
        • Triple Top Chart Pattern
        • Triple Bottom Chart Pattern
      • Continuation Patterns
        • Symmetrical Triangle Chart Pattern
        • Ascending Triangle Chart Pattern
        • Descending Triangle Chart Pattern
        • Rectangle Chart Pattern Pattern
        • Flag and Pennants Chart Pattern
    • Harmonic Patterns
    • Technical Indicators
      • Moving Average SMA and EMA
      • Bollinger Band Indicator
      • Relative Strength Index (RSI)
  • Blog
  • Connect
    • Contact
    • You Tube

Blog

Profit and Stocks > Blog > Blog > Long terms always pay is myth-Trade/invest wisely

Long terms always pay is myth-Trade/invest wisely

access_timeFebruary 24, 2021
perm_identity Posted by Profit and Stocks
folder_open Blog

Dear Trader,

Long terms is term very often used by Market analyst or traders. In my opinion, this is myth that long term always pay. Some trader says i have invested for long terms, how much is long term and how much is target or returns expected.

Just imagine you have started trading/investing in 2011 (considering 10 year horizon 2011-2021), let us take 3 years, 5 years and 10 years horizon for some stocks, i have chosen Tata motors, Bharti Airtel, GAIL, BHEL, ITC (I have chosen well known stocks in 2011). You can study others based on same. Just look at these below, the observations are:-

Airtel—Negative returns in 3 years, 5 years, but good returns only in last 3 years.
GAIL- Negative in 3 and 5 years, same level even in 10 years. Maximum return from 2016–2019
ITC-10 years returns are less than 3 and 5 years returns. (maximum in 8 years)
TATAMOTORS- 3 years ,5 years and 10 years returns are same. Maximum is from 2012 to 2015
BHEL-Negative return in 3 years, more negative in 10 years.

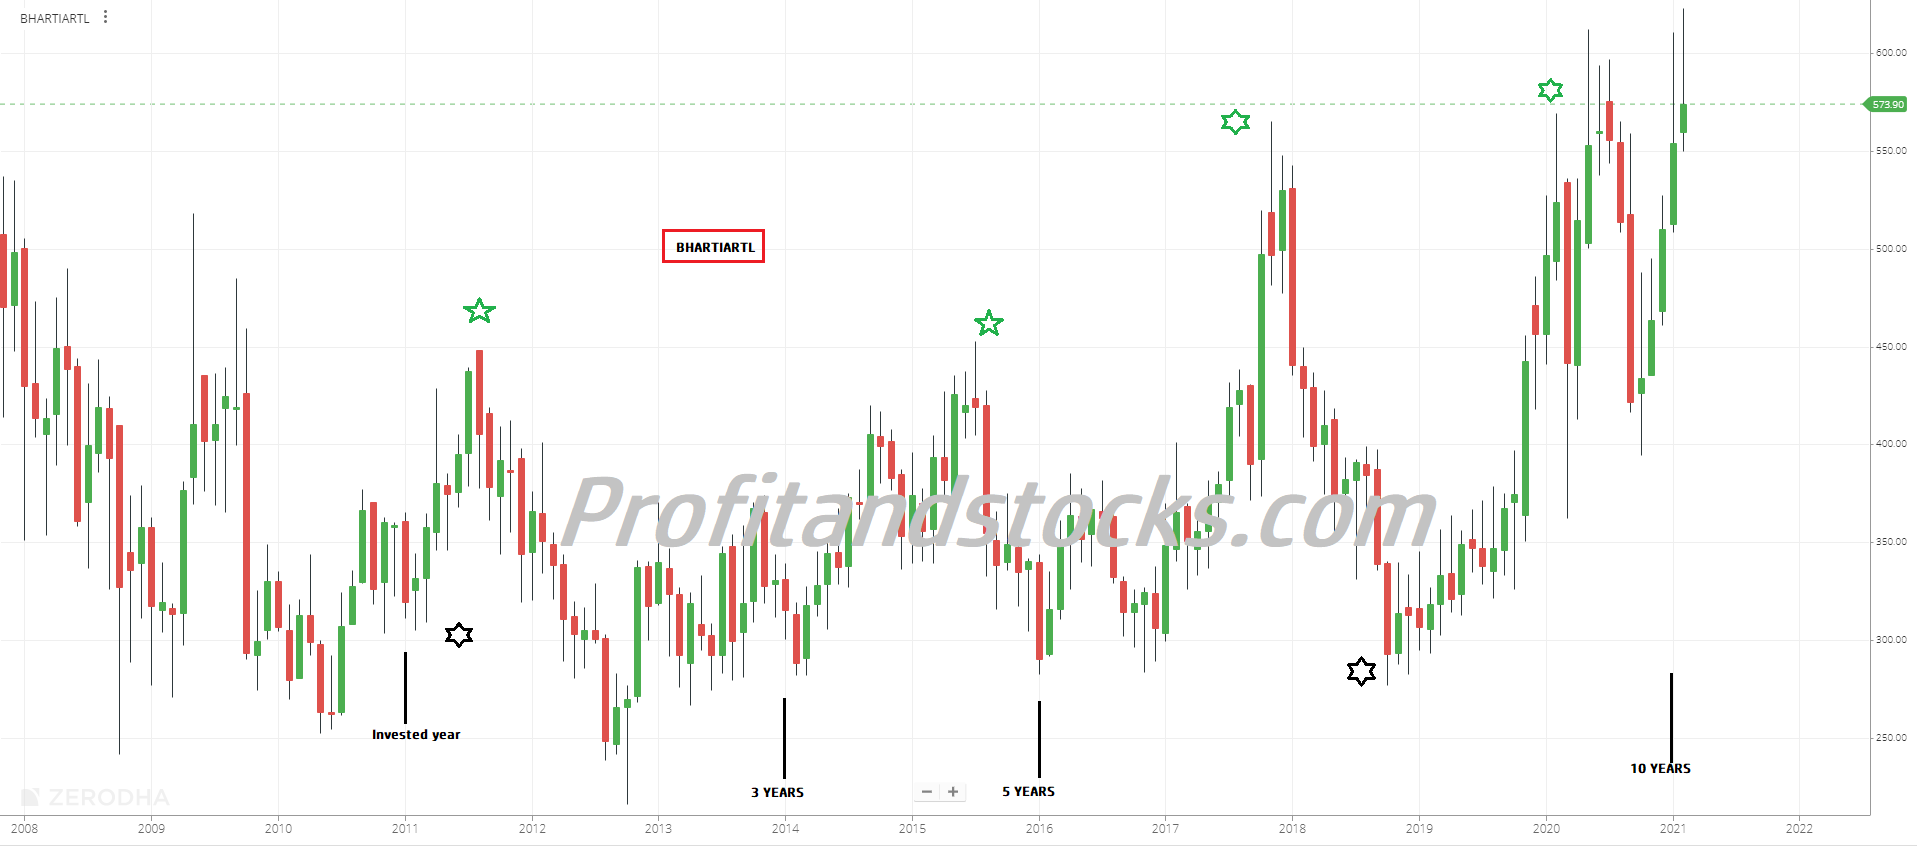
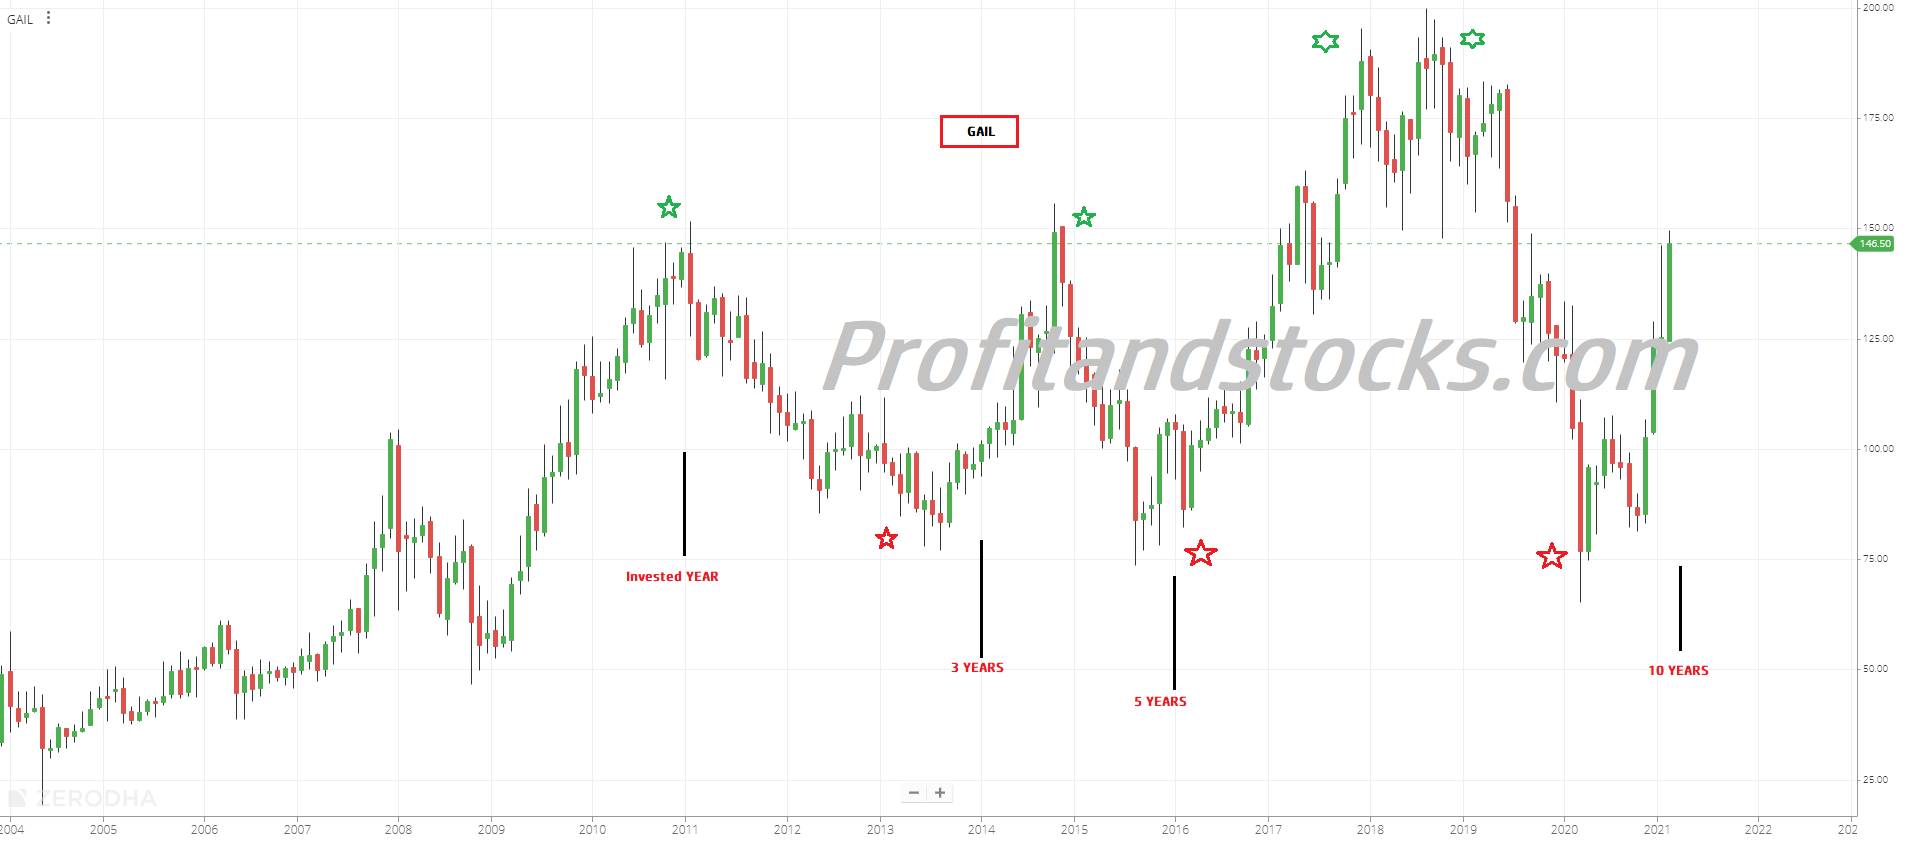
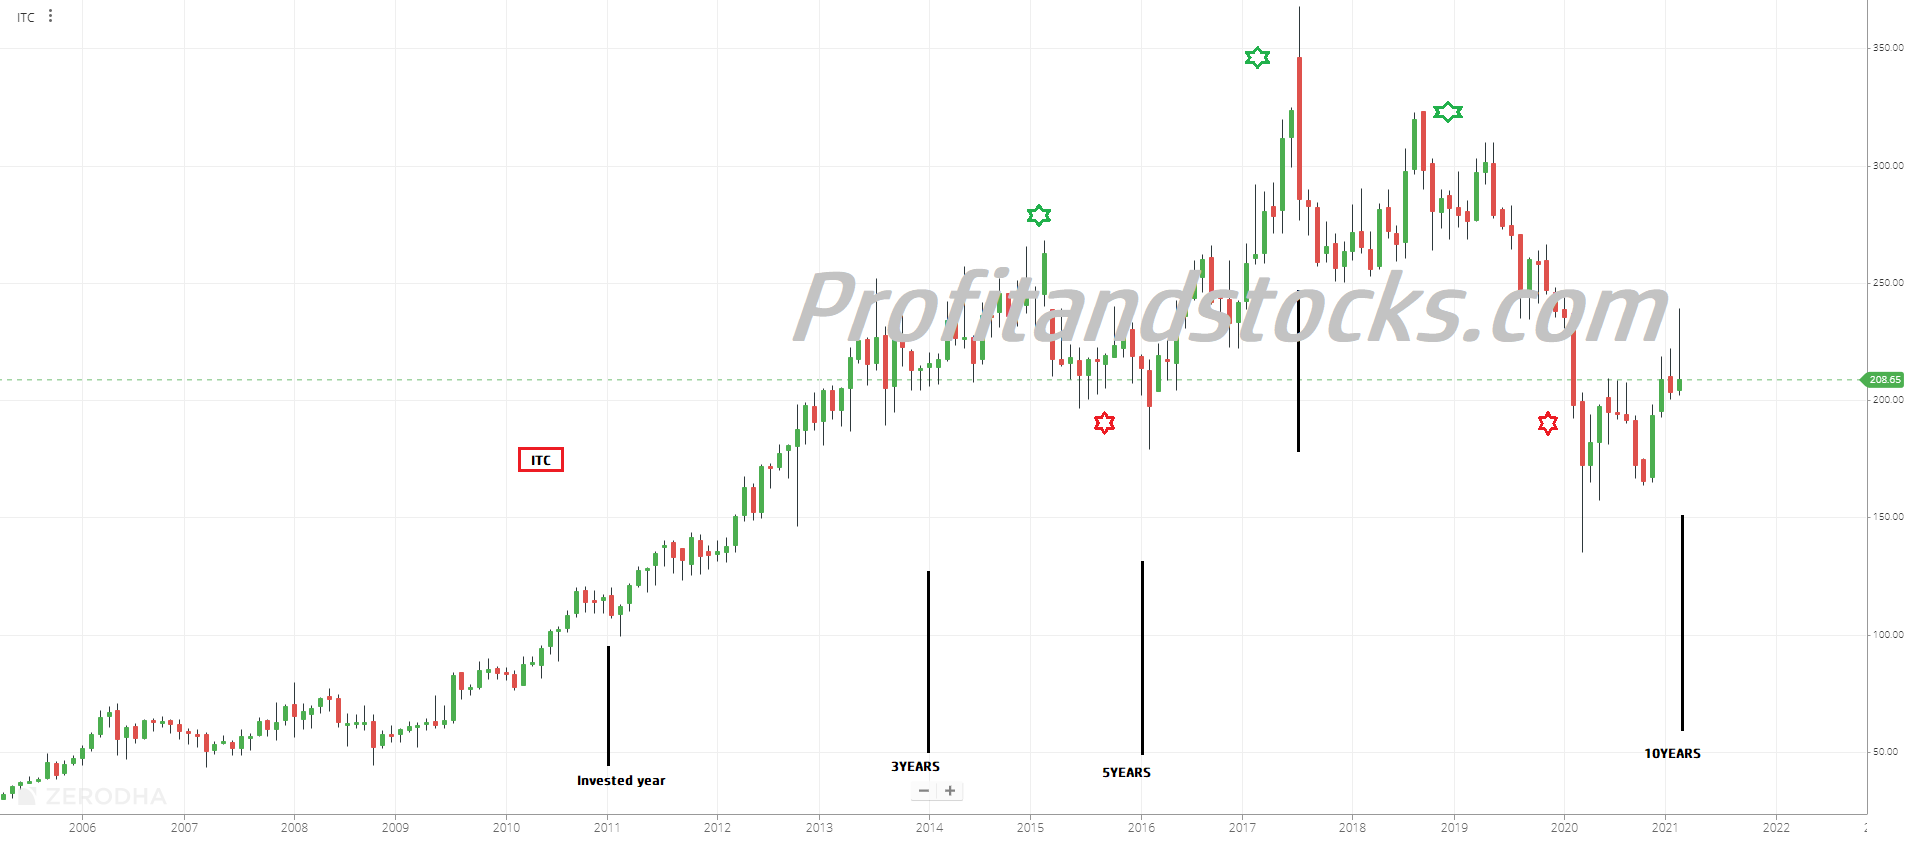
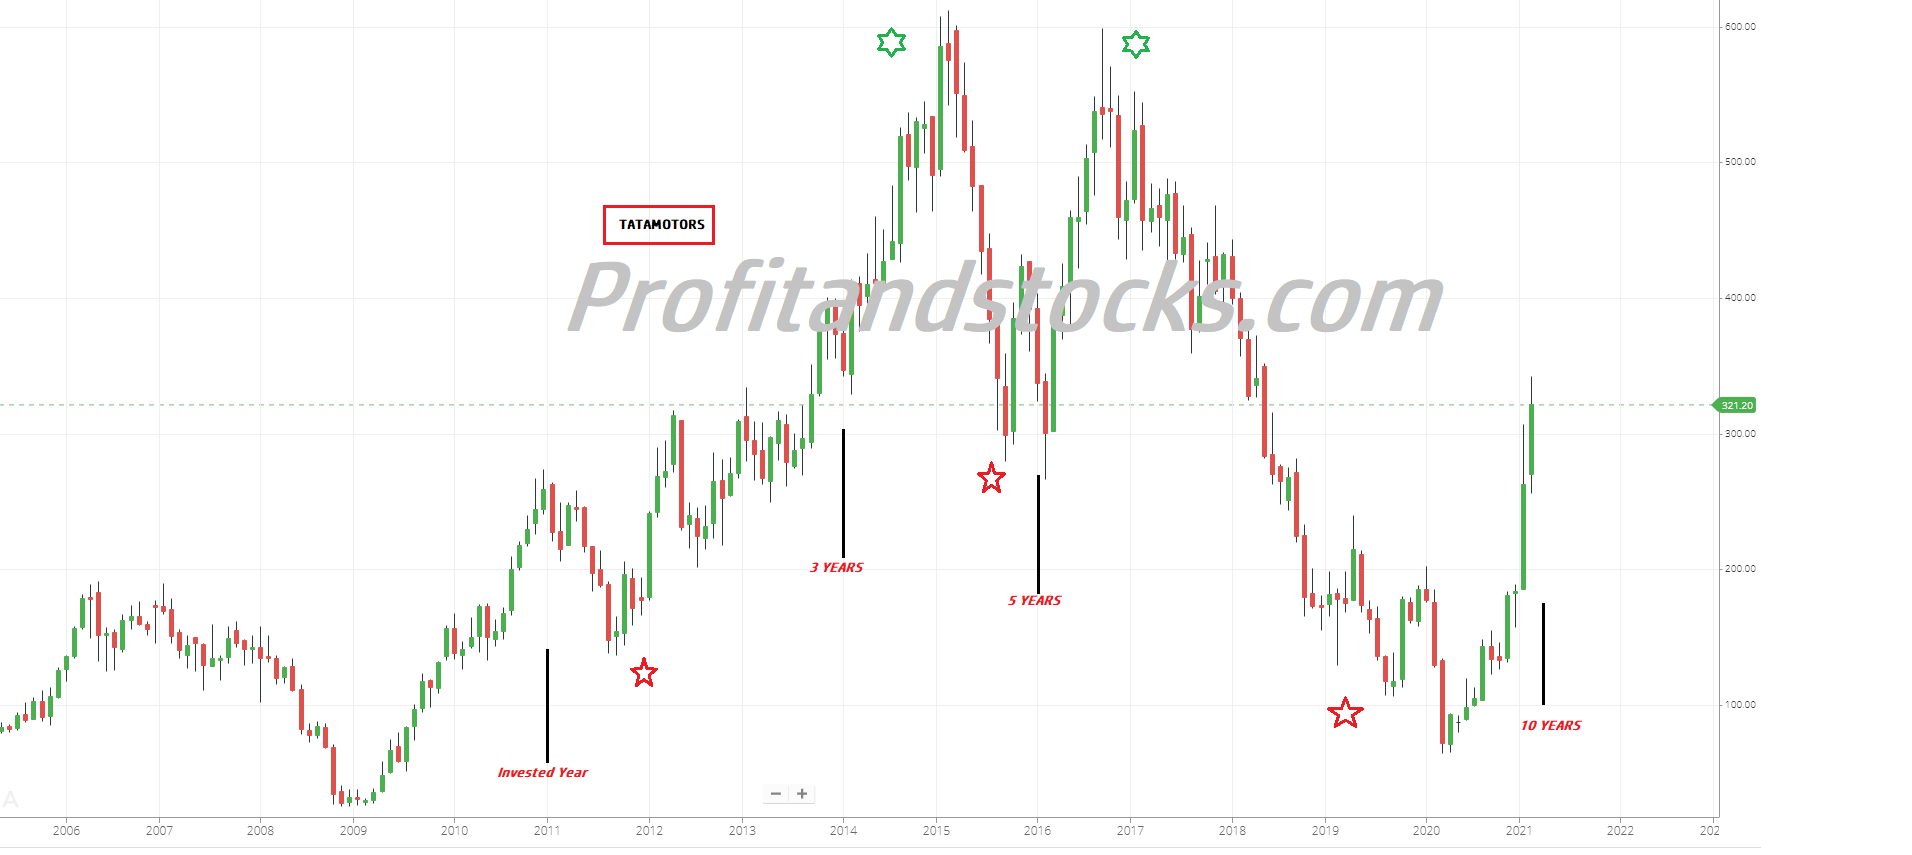
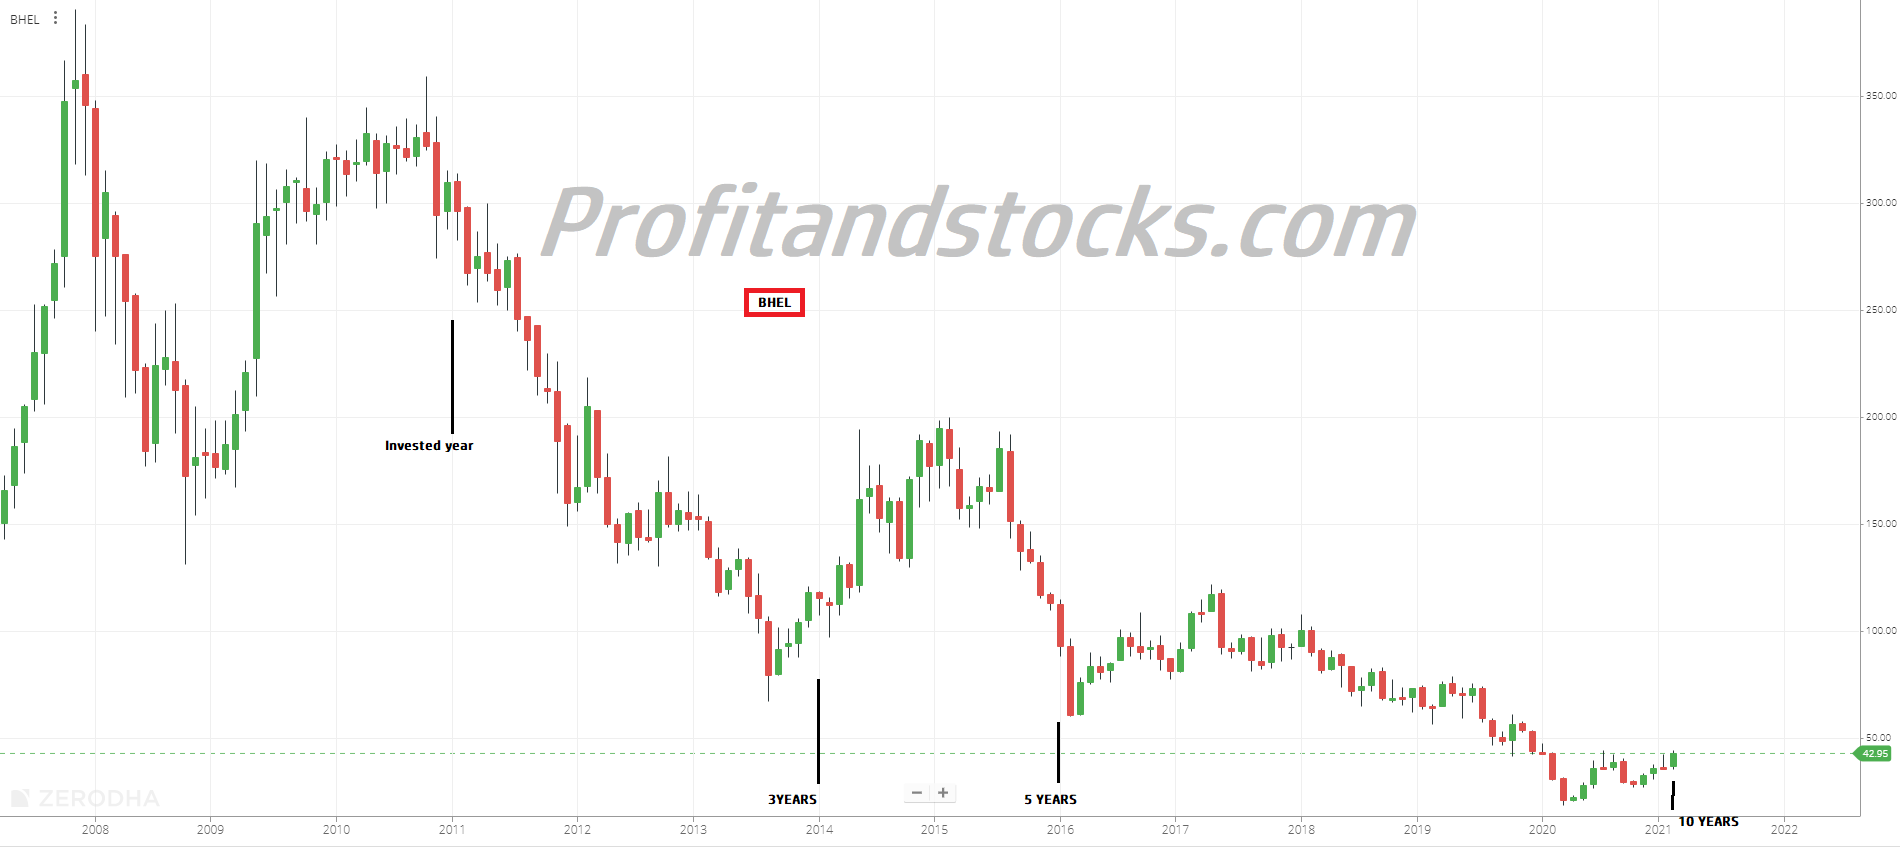
So in nut shell, there is no equation of returns with respect to time. You need to study and plan your trade well. Define your trading style and rules and just follow those. Trader tend to buy those stocks which are having less value in absolute terms or keep buying or averaging those stocks which are continuously falling. Always trade what you see, not what you think. Emotions has no value in market trading. If your returns are less then or equal to Fixed Deposit, then its loss for the trader. Even if its same return, it is time loss for trader.

In past charts , things are very easy to see that i should have exited at these levels or i should have bought at these levels, but when it comes to live market, its the real and practical knowledge which will make your decision based on your backtested trade plan wrt your trading style.

happy trading 🙂

Tags: Professional TraderStock MarketTrade PlanTrading
Newer BUY and SELL TRAPS
Older How do you make a Financial or stock market study interesting and effective?

Leave a Reply Cancel reply

Search for:
Recent Posts
  • How to become profitable from heavy losses in Stock Market
  • Stock market and psychology
  • Difference Between Investing and Trading
  • WHY INTRADAY IS MORE COMPLEX TO TRADE THAN POSITIONAL
  • How do you make a Financial or stock market study interesting and effective?
Categories
  • Blog
  • blogs
Archives
  • August 2023
  • June 2023
  • March 2023
  • March 2021
  • February 2021
  • August 2020
  • May 2020
  • March 2020
  • November 2019
ADDRESS
  • location_on
    Flat No.-706,Tower-Beauty, The Seven Lamps, Sector-82, Gurgaon, Haryana-122004
  • phone_android
    +91-9560531632, +91-8527181706
  • email
    Profitandstocks@gmail.com
ABOUT

Profit and Stocks is an exceptional team of market traders with over 12+ years of combined trading experience. Profitandstocks.com is a full-service trading Training/ education and mentoring company managed by Mr. S. Kumar (NISM Certified Research Analyst), a passionately curious and independent trader in the financial markets for the last decade. Our broad and global mission is to provide the right approach, Training, and Guidance to struggling traders and investors.

RECENT POSTS
  • How to become profitable from heavy losses in Stock Market
  • Stock market and psychology
  • Difference Between Investing and Trading
  • WHY INTRADAY IS MORE COMPLEX TO TRADE THAN POSITIONAL
  • How do you make a Financial or stock market study interesting and effective?
© 2018 Profit and Stocks. All rights reserved| Disclaimer
keyboard_arrow_up