Bollinger Band was developed by John Bollinger, are volatility bands placed above and below a moving average (S20). Volatility is based on the standard deviation (2), which changes as volatility increases and decreases. The bands automatically widen when volatility increases and narrow when volatility decreases.
Middle Bollinger Band – This is a plot of 20 period simple moving average.
Lower Bollinger Band – Middle hand –2*20 period standard Deviation.
Upper Bollinger Band – Middle hand 2 * 20 period standard Deviation.
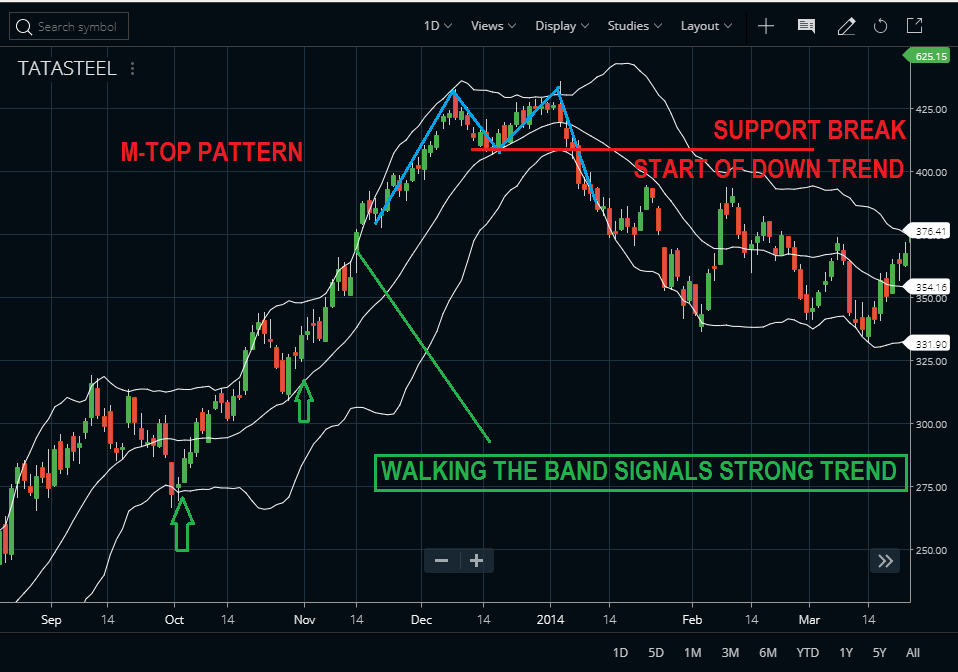
 A “M-Top” forms in an uptrend and involves two reaction highs. In particular, Bollinger looks for M-Top where the second high is higher or lower than the first, but holds below the upper band. The ability to hold second high below the upper band on the test shows less strength and the pattern is confirmed with a strong move down off the second high and a support breakdown.
Standard period settings for Bollinger Band.
Bollinger recommends to use S(20,2) as default Setting, However periods setting may be altered as S(50.2.1) for long term trading and S(10,1.9) for short term tradingUse of Bollinger Bands for Trading
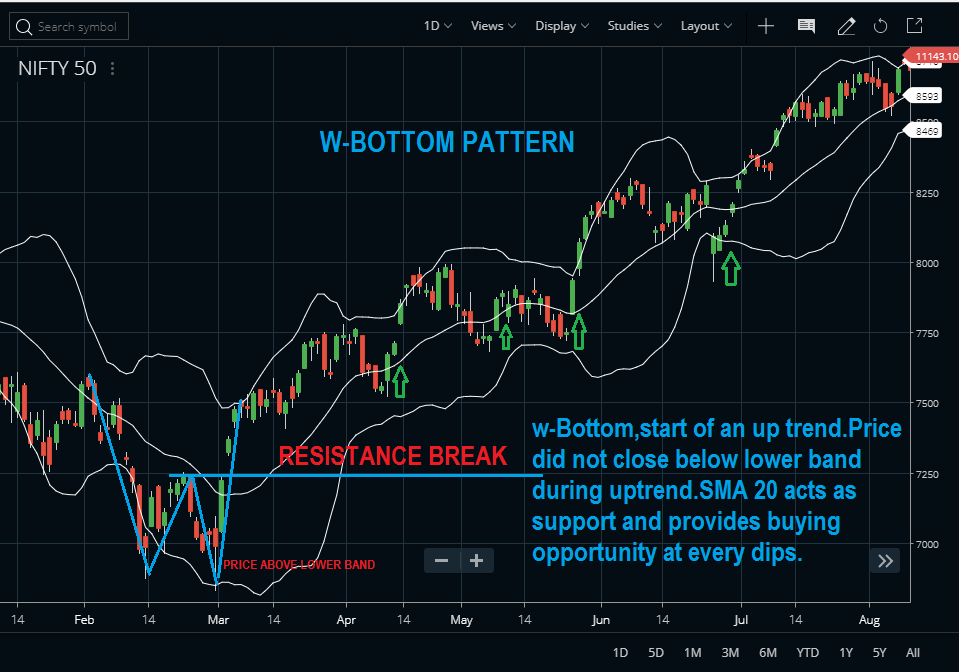
A “W-Bottom” forms in a downtrend and involves two reaction lows. In particular, Bollinger looks for W-Bottoms where the second low is lower than the first, but holds above the lower band. The ability to hold second low above the lower band on the test shows less weakness on the last decline and the pattern is confirmed with a strong move off the second low and a resistance break.
A “M-Top” forms in an uptrend and involves two reaction highs. In particular, Bollinger looks for M-Top where the second high is higher or lower than the first, but holds below the upper band. The ability to hold second high below the upper band on the test shows less strength and the pattern is confirmed with a strong move down off the second high and a support breakdown.