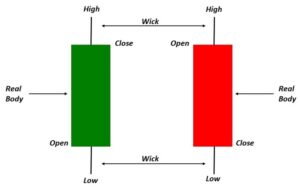
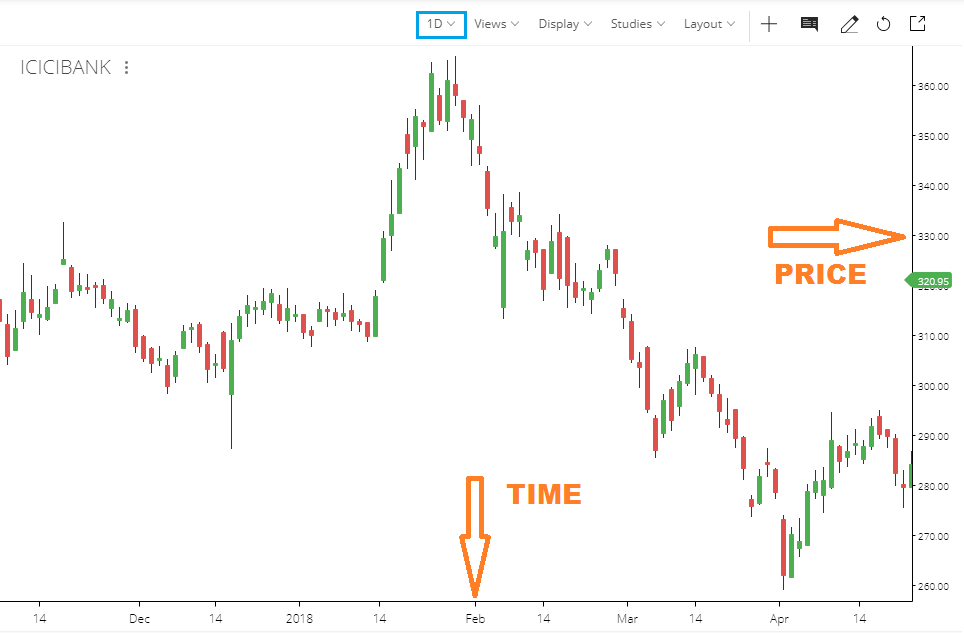
Candlestick charting appeared around four centuries ago in Japan. Candlestick signals depict changes in investor psychology and it works well with all market with all time frames. In order to create a candlestick chart, you must have a data set that contains open, high, low and close values for each time period you want to display. The filled portion of the candlestick is called “the body. The long thin lines above and below the body represent the high/low range and are called “shadows”. The high is marked by the top of the upper shadow and the low by the bottom of the lower shadow. If the stock closes higher than its opening price, a filled (green) candlestick is drawn with the bottom of the body represents the opening price and the top of the body representing the closing price. If the stock closes lower than its opening price, a filled (red) candlestick is drawn with the bottom of the body representing the closing price and the top of the body representing the opening price.
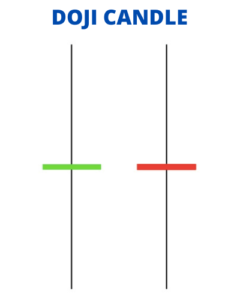
 The Doji signal represents indecision and more powerful when market is in oversold and overbought conditions. The formations take place when open and the close of the stock is almost at the same price level. At the top of an uptrend, when prices are in overbought conditions, it cautions the trader to start booking in profits. At the bottom of a downtrend, when prices are in oversold conditions, it signals the trader to that bear market is getting tired.
 The Hammer signal is found at the bottom of a downtrend. The lower shadow must be at least twice the size of the body. There should be no upper shadow or a very small upper shadow. The colour of the body does not matter, but a white body would be more positive than a black body. In order to make sure the bulls retain control of the stock, one needs to verify strength the next day. If on the next day, the stock closes down, the Hammer signal should not be relied upon as a sign of reversal at that point in the trend.
 The Hanging Man signal is found at the top of an uptrend. The lower shadow must be at least twice the size of the body. There should be no upper shadow or a very small upper shadow. The colour of the body does not matter, but a black body would be more positive than a white body. It is Similar to the Inverted Hammer.
The Inverted Hammer signal is found at the bottom of a downtrend. The Upper shadow must be at least twice the size of the body. The day after the Inverted Hammer is formed, one should witness continued buying. There should be no lower shadow or a very small lower shadow. The colour of the body does not matter, but a white body would be more positive than a black body. The Inverted Hammer signal signifies the downtrend may be over. The key is to see who controls the stock on the following day. If the stock closes with a good bullish candle, the bears will give up.
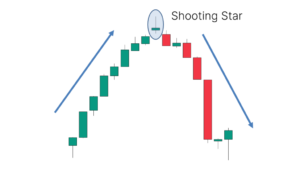
The Shooting Star signal is found at the top of an uptrend. The Upper shadow must be at least twice the size of the body. There should be no lower shadow or a very small lower shadow. The colour of the body does not matter, but a black body would be more positive than a white body. If the bears manage to close the stock lower the next day, the bulls will generally step away and the uptrend will reverse.
The Hanging Man signal is found at the top of an uptrend. The lower shadow must be at least twice the size of the body. There should be no upper shadow or a very small upper shadow. The colour of the body does not matter, but a black body would be more positive than a white body. It is Similar to the Inverted Hammer.
The Inverted Hammer signal is found at the bottom of a downtrend. The Upper shadow must be at least twice the size of the body. The day after the Inverted Hammer is formed, one should witness continued buying. There should be no lower shadow or a very small lower shadow. The colour of the body does not matter, but a white body would be more positive than a black body. The Inverted Hammer signal signifies the downtrend may be over. The key is to see who controls the stock on the following day. If the stock closes with a good bullish candle, the bears will give up.
The Shooting Star signal is found at the top of an uptrend. The Upper shadow must be at least twice the size of the body. There should be no lower shadow or a very small lower shadow. The colour of the body does not matter, but a black body would be more positive than a white body. If the bears manage to close the stock lower the next day, the bulls will generally step away and the uptrend will reverse.
 The Bullish Engulfing signal is found at the bottom of a downtrend. It is up day candle opening below the Close of the previous day and closing above the Open of the previous day’s red candle, completely engulfing the previous day range.
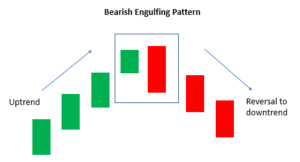 The Bearish Engulfing signal is found at the top of an uptrend. It is down day candle opening above the Close of the previous day and closing below the Open of the previous day’s green candle, completely engulfing the previous day range.
The Piercing signal is found at the bottom of a downtrend. The second day of the signal should be a white candle opening below the low of the previous day and closing more than halfway into the body of the previous day’s black candle. The bears are having fun in the downtrend. Then one day the price gaps down. There is panic in the street. Everybody wants OUT! But that is the exact point smart money starts buying. They manage to close the candle more than halfway into the previous day’s black candle. If on the next day the bulls can hold control, the bears will move away and the downtrend will have a high chance of reversal.
The Bearish Engulfing signal is found at the top of an uptrend. It is down day candle opening above the Close of the previous day and closing below the Open of the previous day’s green candle, completely engulfing the previous day range.
The Piercing signal is found at the bottom of a downtrend. The second day of the signal should be a white candle opening below the low of the previous day and closing more than halfway into the body of the previous day’s black candle. The bears are having fun in the downtrend. Then one day the price gaps down. There is panic in the street. Everybody wants OUT! But that is the exact point smart money starts buying. They manage to close the candle more than halfway into the previous day’s black candle. If on the next day the bulls can hold control, the bears will move away and the downtrend will have a high chance of reversal.
The Bullish Harami signal is found at the bottom of a downtrend. The second day of the signal should be a white candle opening above the Close of the previous day and closing below the Open of the previous day’s black candle. During a downtrend, there comes a time when the investors who have held long hoping for a reversal, finally give in. There is panic selling in the street. At the end of the day one can witness along black candle. However, smart money is waiting for this opportunity. The next day, the stock gaps up and bulls start piling in. The shorts are nervous now. The bulls manage to close the candle higher into the previous day’s body. If the next day, the bulls confirm their stay, the bears will move away and the downtrend will have a high probability of reversal.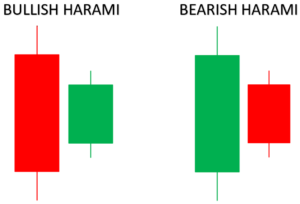 The Bearish Harami signal is found at the top of an uptrend. The second day of the signal should be a dark candle opening below the Close of the previous day and closing above the Open of the previous day’s white candle. It is just opposite to Bullish Harami except it forms at the top of uptrend.
The Morning Star signal is found at the bottom of a downtrend, which foretells of good morning to come, this signal too suggests that higher stock prices could be on the way. The first day of the signal must be a long dark body. The second day must be a day of indecision. The third day should be a long white candle reaching at least halfway into the body of the first day’s dark candle.
The Bearish Harami signal is found at the top of an uptrend. The second day of the signal should be a dark candle opening below the Close of the previous day and closing above the Open of the previous day’s white candle. It is just opposite to Bullish Harami except it forms at the top of uptrend.
The Morning Star signal is found at the bottom of a downtrend, which foretells of good morning to come, this signal too suggests that higher stock prices could be on the way. The first day of the signal must be a long dark body. The second day must be a day of indecision. The third day should be a long white candle reaching at least halfway into the body of the first day’s dark candle.
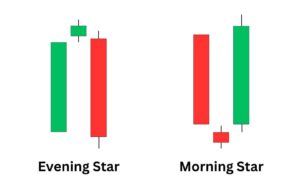 The Evening Star signal is found at the top of an uptrend, which foretells of bad things (night) to come, this signal too suggests that lower stock prices could be on the way. The first day of the signal must be a long white body. The second day must be a day of indecision. The third day should be a long dark candle reaching down at least halfway into the body of the first day’s white candle.
Where to Look for candlestick Patterns?
The Evening Star signal is found at the top of an uptrend, which foretells of bad things (night) to come, this signal too suggests that lower stock prices could be on the way. The first day of the signal must be a long white body. The second day must be a day of indecision. The third day should be a long dark candle reaching down at least halfway into the body of the first day’s white candle.
Where to Look for candlestick Patterns?
 All two or three combination of candlesticks is variations of one of the single candlestick Hammer, Hanging Man, Shooting Star or Inverted Hammer. All four candlesticks can be named as Pin Bar or Rejection Bar. Look at above case A, two candles represents bearish engulfing; in case of daily chart this will represent market behaviour of two days. When you observe carefully and record open, high, low and close of two days and then draw a candlestick this will become a pin bar reversal so called inverted hammer or shooting star. In case Two candles form a single Hammer or Hanging Man which is also a pin bar or rejection bar.
So you don’t have to remember each candlestick, Just focus on art of reading candlestick.
All two or three combination of candlesticks is variations of one of the single candlestick Hammer, Hanging Man, Shooting Star or Inverted Hammer. All four candlesticks can be named as Pin Bar or Rejection Bar. Look at above case A, two candles represents bearish engulfing; in case of daily chart this will represent market behaviour of two days. When you observe carefully and record open, high, low and close of two days and then draw a candlestick this will become a pin bar reversal so called inverted hammer or shooting star. In case Two candles form a single Hammer or Hanging Man which is also a pin bar or rejection bar.
So you don’t have to remember each candlestick, Just focus on art of reading candlestick.
The Doji signal represents indecision and more powerful when market is in oversold and overbought conditions. The formations take place when open and the close of the stock is almost at the same price level. At the top of an uptrend, when prices are in overbought conditions, it cautions the trader to start booking in profits. At the bottom of a downtrend, when prices are in oversold conditions, it signals the trader to that bear market is getting tired.
The Hammer signal is found at the bottom of a downtrend. The lower shadow must be at least twice the size of the body. There should be no upper shadow or a very small upper shadow. The colour of the body does not matter, but a white body would be more positive than a black body. In order to make sure the bulls retain control of the stock, one needs to verify strength the next day. If on the next day, the stock closes down, the Hammer signal should not be relied upon as a sign of reversal at that point in the trend.
The Hanging Man signal is found at the top of an uptrend. The lower shadow must be at least twice the size of the body. There should be no upper shadow or a very small upper shadow. The colour of the body does not matter, but a black body would be more positive than a white body. It is Similar to the Inverted Hammer.
The Inverted Hammer signal is found at the bottom of a downtrend. The Upper shadow must be at least twice the size of the body. The day after the Inverted Hammer is formed, one should witness continued buying. There should be no lower shadow or a very small lower shadow. The colour of the body does not matter, but a white body would be more positive than a black body. The Inverted Hammer signal signifies the downtrend may be over. The key is to see who controls the stock on the following day. If the stock closes with a good bullish candle, the bears will give up.
The Shooting Star signal is found at the top of an uptrend. The Upper shadow must be at least twice the size of the body. There should be no lower shadow or a very small lower shadow. The colour of the body does not matter, but a black body would be more positive than a white body. If the bears manage to close the stock lower the next day, the bulls will generally step away and the uptrend will reverse.
The Bullish Engulfing signal is found at the bottom of a downtrend. It is up day candle opening below the Close of the previous day and closing above the Open of the previous day’s red candle, completely engulfing the previous day range.
The Bearish Engulfing signal is found at the top of an uptrend. It is down day candle opening above the Close of the previous day and closing below the Open of the previous day’s green candle, completely engulfing the previous day range.
The Piercing signal is found at the bottom of a downtrend. The second day of the signal should be a white candle opening below the low of the previous day and closing more than halfway into the body of the previous day’s black candle. The bears are having fun in the downtrend. Then one day the price gaps down. There is panic in the street. Everybody wants OUT! But that is the exact point smart money starts buying. They manage to close the candle more than halfway into the previous day’s black candle. If on the next day the bulls can hold control, the bears will move away and the downtrend will have a high chance of reversal.
The Bullish Harami signal is found at the bottom of a downtrend. The second day of the signal should be a white candle opening above the Close of the previous day and closing below the Open of the previous day’s black candle. During a downtrend, there comes a time when the investors who have held long hoping for a reversal, finally give in. There is panic selling in the street. At the end of the day one can witness along black candle. However, smart money is waiting for this opportunity. The next day, the stock gaps up and bulls start piling in. The shorts are nervous now. The bulls manage to close the candle higher into the previous day’s body. If the next day, the bulls confirm their stay, the bears will move away and the downtrend will have a high probability of reversal.
The Bearish Harami signal is found at the top of an uptrend. The second day of the signal should be a dark candle opening below the Close of the previous day and closing above the Open of the previous day’s white candle. It is just opposite to Bullish Harami except it forms at the top of uptrend.
The Morning Star signal is found at the bottom of a downtrend, which foretells of good morning to come, this signal too suggests that higher stock prices could be on the way. The first day of the signal must be a long dark body. The second day must be a day of indecision. The third day should be a long white candle reaching at least halfway into the body of the first day’s dark candle.
The Evening Star signal is found at the top of an uptrend, which foretells of bad things (night) to come, this signal too suggests that lower stock prices could be on the way. The first day of the signal must be a long white body. The second day must be a day of indecision. The third day should be a long dark candle reaching down at least halfway into the body of the first day’s white candle.
Where to Look for candlestick Patterns?
- At Support in up trend
- At resistance in downtrend
- At Touch of Trend line
- At Touch of Moving Average
- At O/B and O/S zone
ART OF READING CANDLESTICKS
All two or three combination of candlesticks is variations of one of the single candlestick Hammer, Hanging Man, Shooting Star or Inverted Hammer. All four candlesticks can be named as Pin Bar or Rejection Bar. Look at above case A, two candles represents bearish engulfing; in case of daily chart this will represent market behaviour of two days. When you observe carefully and record open, high, low and close of two days and then draw a candlestick this will become a pin bar reversal so called inverted hammer or shooting star. In case Two candles form a single Hammer or Hanging Man which is also a pin bar or rejection bar.
So you don’t have to remember each candlestick, Just focus on art of reading candlestick.