Let’s take a close look now at what is probably the best known and most reliable of all major reversal patterns—the head and shoulders reversal. We’ll spend more time on this pattern because it is important and also to explain all the nuances involved. Most of the other reversal patterns are just variations of the head and shoulders and will not require as extensive a treatment.
Let’s see how this scenario would look on a head and shoulders top. (See Figures below.) At point A, the uptrend is proceeding as expected with no signs of a top. Volume expands on the price move into new highs, which is normal. The corrective dip to point B is on lighter volume, which is also to be expected. At point C, however, the alert chartist might notice that the volume on the upside breakout through point A is a bit lighter than on the previous rally. This change is not in itself of major importance, but a little yellow caution light goes on in the back of the analyst’s head.
Prices then begin to decline to point D and something even more disturbing happens. The decline carries below the top of the previous peak at point A. Remember that, in an uptrend, a penetrated peak should function as support on subsequent corrections. The decline well under point A, almost to the previous reaction low at point B, is another warning that something may be going wrong with the uptrend.
The market rallies again to point E, this time on even lighter volume, and isn’t able to reach the top of the previous peak at point C. (That last rally at point E will often retrace one half to two-thirds of the decline from points C to D.) To continue an uptrend, each high point must exceed the high point of the rally preceding it. The failure of the rally at point E to reach the previous peak at point C fulfills half of the requirement for a new downtrend namely, descending peaks.
By this time, the major up trend line (line 1) has already been broken, usually at point D, constituting another danger signal. But, despite all of these warnings, all that we know at this point is that the trend has shifted from up to sideways. This might be sufficient cause to liquidate long positions, but not necessarily enough to justify new short sales.
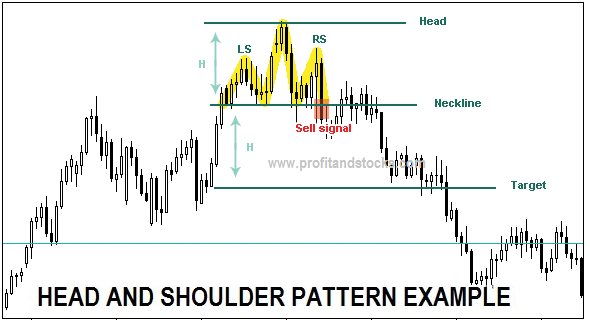
The Breaking of the Neckline Completes the Pattern By this time, a flatter trend line can be drawn under the last two reaction lows (points B and D), which is called a neckline (see line 2). This line generally has a slight upward slope at tops (although it’s sometimes horizontal and, less often, tilts downward). The deciding factor in the resolution of the head and shoulders top is a decisive closing violation of that neckline. The market has now violated the trend line along the bottom of points B and D, has broken under support at point D, and has completed the requirement for a new downtrend—descending peaks and troughs. The new downtrend is now identified by the declining highs and lows at points C, D, E, and E Volume should increase on the breaking of the neckline. A sharp increase in downside volume, however, is not critically important in the initial stages of a market top. The Return Move Usually a return move develops which is a bounce back to the bottom of the neckline or to the previous reaction low at point D (see point G), both of which have now become overhead resistance. The return move does not always occur or is sometimes only a very minor bounce. Volume may help determine the size of the bounce. If the initial breaking of the neckline is on very heavy trading, the odds for a return move are diminished because the increased activity reflects greater downside pressure. Lighter volume on the initial break of the neckline increases the likelihood of a return move. That bounce, however, should be on light volume and the subsequent resumption of the new downtrend should be accompanied by noticeably heavier trading activity. FINDING A PRICE OBJECTIVE The method of arriving at a price objective is based on the height of the pattern. Take the vertical distance from the head (point C) to the neckline. Then project that distance from the point where the neckline is broken.It’s important to remember that the objective arrived at is only a minimum target. Prices will often move well beyond the objective. Having a minimum target to work with, however, is very helpful in determining beforehand whether there is enough potential in a market move to warrant taking a position. If the market exceeds the price objective, that’s just icing on the cake. The maximum objective is the size of the prior move.
After the market makes a lower low, it finds strong support which forms the head of the pattern. The market finds resistance at the neckline once more, which forms the second shoulder. At this point the inverse head and shoulders is taking shape but the pattern isn’t confirmed just yet.One area where a lot of traders go wrong is thinking that the pattern is confirmed as soon as the second shoulder forms. Although the pattern begins taking shape at this stage, it isn’t confirmed until the market closes above neckline resistance.This break and close above neckline confirms the inverse head and shoulders pattern and also signals a breakout opportunity.
The Breaking of the Neckline Completes the Pattern By this time, a flatter trend line can be drawn under the last two reaction lows (points B and D), which is called a neckline (see line 2). This line generally has a slight upward slope at tops (although it’s sometimes horizontal and, less often, tilts downward). The deciding factor in the resolution of the head and shoulders top is a decisive closing violation of that neckline. The market has now violated the trend line along the bottom of points B and D, has broken under support at point D, and has completed the requirement for a new downtrend—descending peaks and troughs. The new downtrend is now identified by the declining highs and lows at points C, D, E, and E Volume should increase on the breaking of the neckline. A sharp increase in downside volume, however, is not critically important in the initial stages of a market top. The Return Move Usually a return move develops which is a bounce back to the bottom of the neckline or to the previous reaction low at point D (see point G), both of which have now become overhead resistance. The return move does not always occur or is sometimes only a very minor bounce. Volume may help determine the size of the bounce. If the initial breaking of the neckline is on very heavy trading, the odds for a return move are diminished because the increased activity reflects greater downside pressure. Lighter volume on the initial break of the neckline increases the likelihood of a return move. That bounce, however, should be on light volume and the subsequent resumption of the new downtrend should be accompanied by noticeably heavier trading activity. FINDING A PRICE OBJECTIVE The method of arriving at a price objective is based on the height of the pattern. Take the vertical distance from the head (point C) to the neckline. Then project that distance from the point where the neckline is broken.It’s important to remember that the objective arrived at is only a minimum target. Prices will often move well beyond the objective. Having a minimum target to work with, however, is very helpful in determining beforehand whether there is enough potential in a market move to warrant taking a position. If the market exceeds the price objective, that’s just icing on the cake. The maximum objective is the size of the prior move.
Inverse Head and Shoulders Pattern
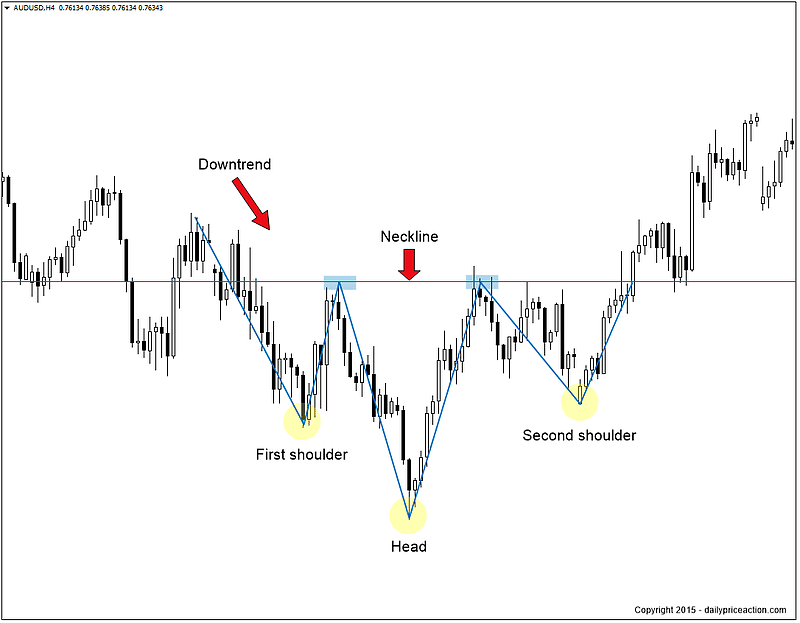
Contrary to the head and shoulders pattern, the inverse head and shoulders pattern occurs after an extended move down. It represents a possible exhaustion point in the market, where traders can begin to look for buying opportunities as the market establishes a bottom and starts to climb higher. The inverse head and shoulders pattern begins with a downtrend. This is the extended move down that eventually leads to exhaustion and a reversal higher as sellers exit and buyers step up. That downtrend is met by minor support, which forms the first shoulder. As the market begins to move higher, it bounces off of strong resistance and the downtrend resumes. This resistance level forms what is called the neckline.
After the market makes a lower low, it finds strong support which forms the head of the pattern. The market finds resistance at the neckline once more, which forms the second shoulder. At this point the inverse head and shoulders is taking shape but the pattern isn’t confirmed just yet.One area where a lot of traders go wrong is thinking that the pattern is confirmed as soon as the second shoulder forms. Although the pattern begins taking shape at this stage, it isn’t confirmed until the market closes above neckline resistance.This break and close above neckline confirms the inverse head and shoulders pattern and also signals a breakout opportunity.