RELATIVE STRENGTH (RSI)

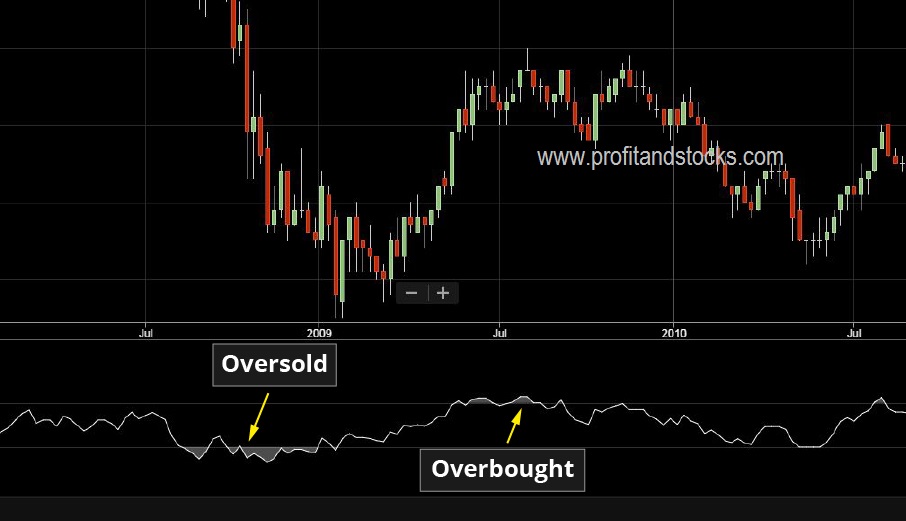
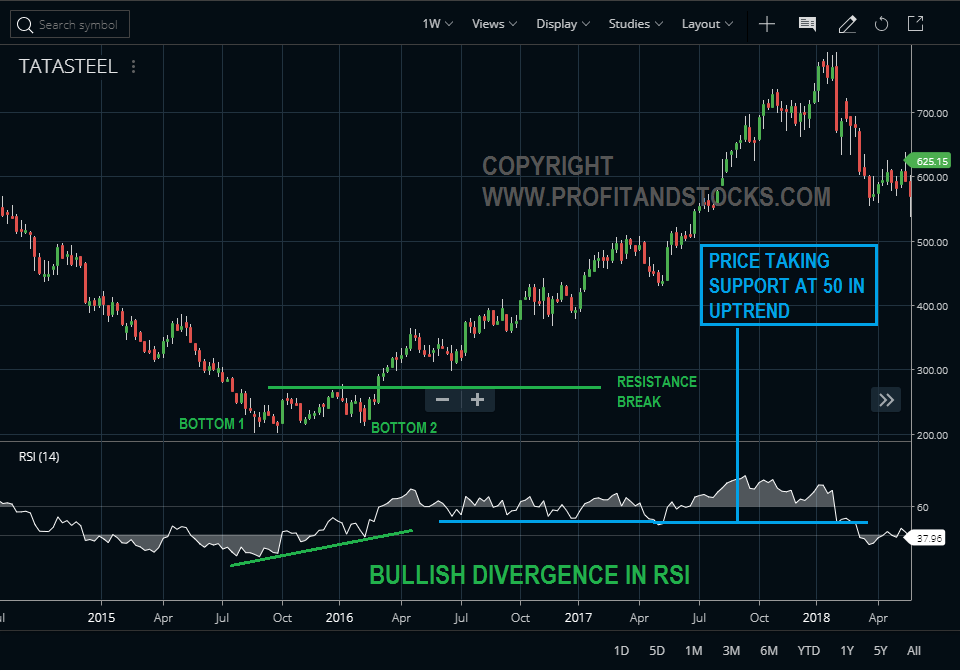
Developed J. Welles Wilder, the Relative Strength Index (RSI) is a momentum oscillator that measures the speed and change of price movements RSI oscillates between 0 and 100 Traditionally, and according to Wilder, RSI is considered overbought when above 70 and oversold when below 30. Signals can also be generated by looking for divergences, failure swings and centre line crossovers. RSI can also be used to identify the general trend RSI is an extremely popular momentum indicator. The default look-back period for RSI is 14, but this can be lowered to increase sensitivity or raised to decrease sensitivity. 10-day RSI is more likely to reach overbought or oversold levels than 20-day RSI. RSI is considered overbought when above 70 and oversold when below 30. These traditional levels can also be adjusted to better fit the security or analytical requirements. Rising overbought to 80 or lowering oversold to 20 will reduce the number of overbought/oversold readings. Short-term traders sometimes use 5-period RSI to look for overbought readings above 80 and oversold readings below 20.RSI tends to fluctuate between 40 and 90 in a bull market (uptrend) with the 40-50 zones acting as support. On the flip side, RSI tends to fluctuate between 10 and 60 in a bear market (downtrend) with the 50-60 zones acting as resistance.

Use of Relative Strength Index (RSI)

Overbought-Oversold

According to Wilder, RSI is considered overbought when above 70 and oversold when below 30 and these overbought/oversold levels works well in sideways market. If market is in strong uptrend then market can remain overbought after reaching 70 and continue to making new high similarly if market is in strong down trend then it can remain oversold after reaching 30 and continue to make new lower lows. So traders should not blindly consider overbought/oversold readings to generate buy/sell signals. It must be confirmed with price action.

Divergence

A bullish divergence occurs when the underlying security makes a lower low and RSI forms a higher low. RSI does not confirm the lower low and this shows strengthening momentum. A bearish divergence forms when the security records a higher high and RSI forms a lower high. RSI does not confirm the new high and this shows weakening momentum. Divergences signal a potential reversal point because directional momentum does not confirm price.

Failure Swings

Failure swings are independent of price action. A bullish failure swing forms when RSI moves below 30 (oversold), bounces above 30, pulls back, holds above 30 and then breaks its prior high. A bearish failure swing forms when RSI moves above 70, pulls back, bounce, fails to exceed 70 and then breaks its prior low. Failure swing signals a very strong potential reversal in the market.