Symmetrical Triangle Definition
The Symmetric triangle is considered a trend continuation pattern and may be formed in both up trends and downtrends. The direction of the trend preceding the pattern’s appearance is confirmed in case of its occurrence on the chart.Formation
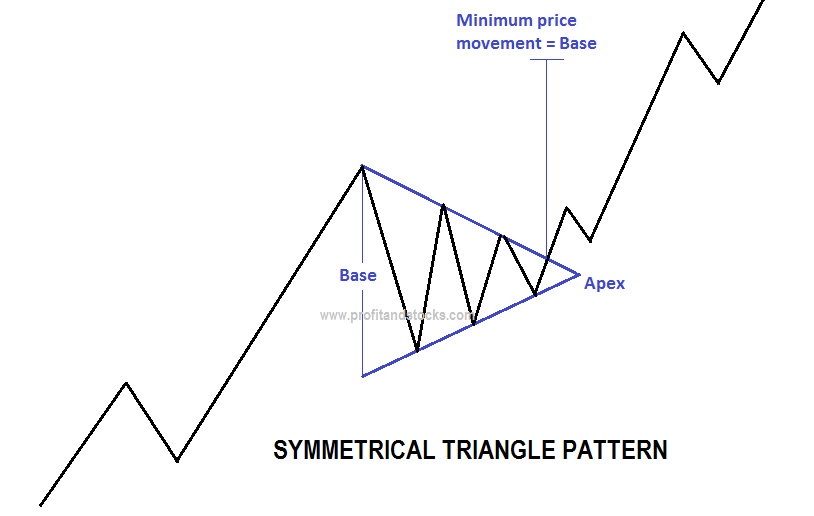
The Symmetric triangle is characterized by a narrowing price range between high and low prices, visually forming a triangle. The main distinctive feature of this type of triangles is that it has a descending trend line (resistance) connecting lower and lower highs and an ascending trend line (support) connecting higher and higher lows. The trend lines’ angles are roughly the same.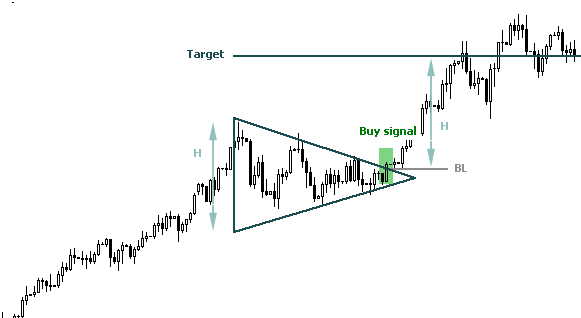
Interpretation of Symmetric Triangle
This pattern confirms the trend movement direction in case of breaking through:- when the triangle is formed in a downtrend and the price breaks below the support line (plus certain deviation is possible), a sell signal is received;
- alternatively if the triangle is formed in an uptrend and the price breaks above the resistance line (plus certain deviation is possible), a buy signal