Introduction
What is Technical Analysis?
John Murphy defines Technical Analysis as “the study of market action, primarily through the use of charts, for the purpose of forecasting future price trends.” Market action refers to price, volume, and open interest data. While analysis of this data can’t make absolute predictions about the future, studying the past price movements on a chart can help technical analysts anticipate what is “likely” to happen to prices going forward.
Technical analysis is applicable to stocks, indices, commodities, futures or any tradable instrument where the price is influenced by the forces of supply and demand. Price data refers to any combination of the open, high, low, close, volume, or open interest for a given security over a specific time frame. The time-frame can be based on intraday (1-minute, 5-minutes, 10-minutes, 15-minutes, 30-minutes or hourly), daily, weekly or monthly price data and last a few hours or many years.
Technical analysis is based on the assumption that all information that can affect the performance of stock, company fundamentals, economic factors and market sentiments, is reflected already in its stock prices. Accordingly, technical analysts do not care to analyze the fundamentals of the business. Instead, the approach is to forecast the direction of prices through the study of patterns in historical market data – price and volume. Technicians believe that market activity will generate indicators in price trends that can be used to forecast the direction and magnitude of stock price movements in future.
Three Premises of Technical Analysis
There are three premises on which the technical approach is based:
- Market action discounts everything.
- Prices move in trends.
- History repeats itself.
Market Action Discounts Everything: The statement “market action discounts everything” forms what is probably the cornerstone of technical analysis. Unless the full significance of this first premise is fully understood and accepted, nothing else that follows makes much sense. Technical analysts believe that the current price fully reflects all information. Because all information is already reflected in the price, it represents the fair value, and should form the basis for analysis. After all, the market price reflects the sum knowledge of all participants, including traders, investors, portfolio managers, buy-side analysts, sell-side analysts, market strategist, technical analysts, fundamental analysts and many others. Technical analysis utilizes the information captured by the price to interpret what the market is saying with the purpose of forming a view on the future.The technician believes that anything that can possible affect the price-fundamentally, politically, psychologically, or otherwise-is actually reflected in the price of that market. It follows, therefore, that a study of price action is all that is required.The technician is claiming that price action should reflect shifts in supply and demand. If demand exceeds supply, prices should rise. If supply exceeds demand, prices should fall. This action is the basis of all economic and fundamental forecasting. The technician then turns this statement around to arrive at the conclusion that if prices are rising, for whatever specific reasons, demand must exceed supply and the fundamentals must be bullish. If prices fall, the fundamentals must be bearish.
Prices Move in Trends: The concept of trend is absolutely essential to the technical approach. The whole purpose of charting the price action of a market is to identify trends in early stages of their development for the purpose of trading in the direction of those trends. In fact, most of the techniques used in this approach are trend-following in nature, meaning, that their intent is to identify and follow existing trends.There is a corollary to the premise that prices move in trends-a trend motion is more likely to continue than to reverse. This corollary is, of course, an adaption of Newton’s first law of motion. Another way to state this corollary is that a trend in motion will continue in the same direction until it reverses. The entire trend-following approach is predicated on riding existing trend until it shows signs of reversing.
History Repeats Itself: Much of the body of technical analysis and the study of market action has to do with the study of human psychology. Chart patterns, for example, which have been identified and categorised over the past one hundred years, reflect certain pictures that appear on price charts. These pictures reveal the bullish or bearish psychology of the market. Since these patterns have worked well in the past, it is assumed that they will continue to work well in the future. They are based on the study of human psychology, which tends not to change. Another way of saying this last premise-that history repeats itself-is that the key to understanding the future lies in a study of the past, or that the future is just a repetition of the past.
Advantages of technical analysis
The advantages of technical analysis are that it can be applied to virtually any trading instrument and in any time frame. Technical analysis can be used to analyse anything from stocks, commodities, interest rates or Forex. You can also apply technical analysis from a short term perspective to a longer term time frame. In fact it can be applied to a chart ranging from minutes on an intra-day time frame to weekly or even monthly time frames.
It is important to understand that technical analysis can be used as a standalone method or it can be incorporated with other methods such as fundamental analysis or market timing methods.
Professional traders use technical analysis to create a set of clear rules and guidelines to assist in the decision making process of when, where and how to enter and exit a trade. For example, it can form part of your trading plan, establishing your rules for entering and exiting trades.
Using popular technical Indicators and chart patterns, a trader can apply readily available tools and techniques to find potential trading opportunities in the global financial markets to assist in successful trading.
Why is technical analysis important?
Many traders and investors use technical analysis to inform them of the direction of markets. Markets are not completely random and if you see a pattern emerging, the chances are many others can too. This makes it almost a self-fulfilling trend. Traders and investors help to create the patterns we see in market prices.
Understanding Technical Charts
Charts are particularly important to Technical Analysts as they believe that past patterns are based on human behaviour and often repeat themselves.Technical Analysts use chart patterns to help predict where prices may move to in the future and they are used to spot trading opportunities.So what information is contained within these charts and how do you “read” them?
A trading chart is made up of three major components: Time, Price and Patterns.
Time
In this example we’re using a daily chart for the ICICI BANK and we can see the price displayed on the vertical or ‘y’ axis and time displayed on the horizontal or ‘x’ axis.
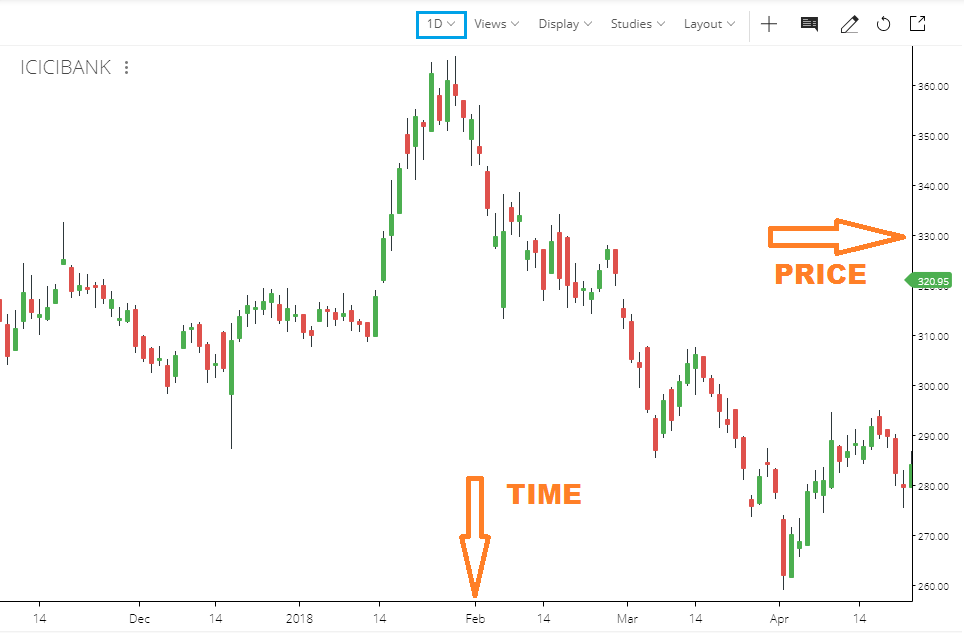
If we want to find out more about how the price of ICICI BANK has changed over time, then we could use the drop down menu to choose a time frame from 1 minute to 1 year.Popular short-term time frames usually range from five to 60 minutes. If we want to hold positions for more than a few hours, we could look at daily charts for an intermediate time frame. Weekly and monthly charts on the other hand could be used for longer-term trades.
Price
The second major component of a chart is the price.Price movements can be displayed in different ways on charts using lines or bars for example, but one of the most popular with traders are candlesticks.Candlesticks are very useful as they can help us to determine the direction of the market with just a glance.By looking at the colour and length of the candlestick, we can tell if the market is getting stronger or weaker, and whether that direction is a short-lived spike or a legitimate change in direction.Each candlestick shows key data for a specific period.
Example
This ICICI BANK chart has a daily time scale, and each Candle represents the trading activity for a one day period.
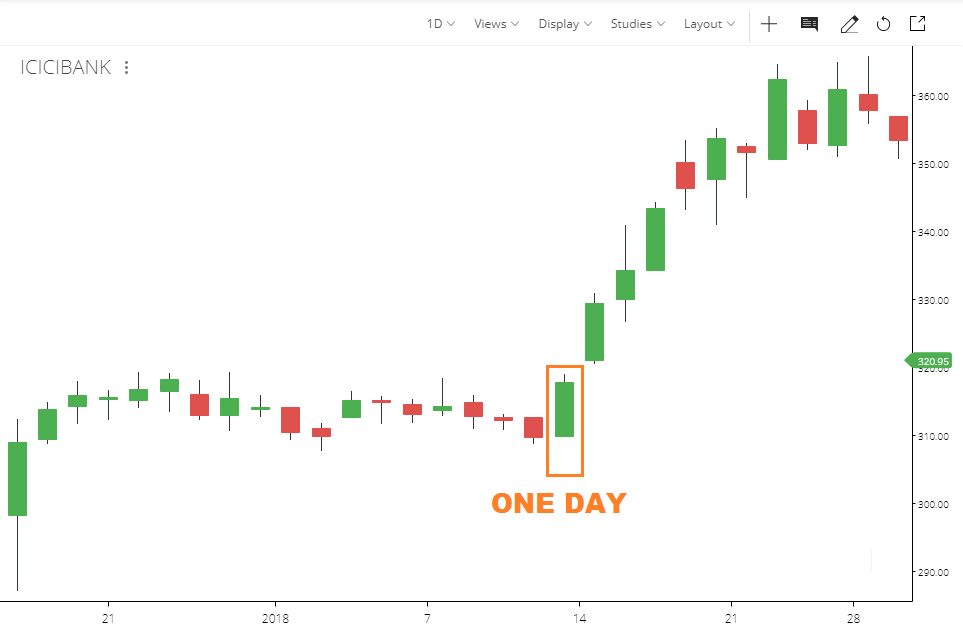
The Candlestick Body is a rectangle that represents all of the trading activity for a specified period.When the price rises, the candle will be green, and when the price of that market drops, the candle will be red. This gives us a visual snapshot of price movement at any given moment. On a green candle, the open price is represented at the bottom of the candle body and the top represents the close price.Generally speaking, the longer the body is, the more intense the buying or selling pressure is.
Long green candles are generally bullish and, after extended declines, might indicate a potential turning point in the trend, or a support level.Long red candles might indicate strong selling pressure as the close price is well below the open.

If the market has been rallying for some time, a long red candle might indicate that the trend is coming to an end, or it could or mark a future resistance level.Candlestick shadows, sometimes called tails or wicks, are the thin lines that we see above and below the candle body.An upper shadow displays the highest price that it traded during that particular session, while a lower shadow shows how low the price went.Candlesticks with a long upper shadow and short lower shadow indicate that buyers dominated the session but then sellers forced prices down from their highs.Conversely, candlesticks with long lower shadows and short upper shadows indicate that sellers dominated the session but buyers later came in and pushed prices higher at the end of the session.
Candlesticks are useful because they represent the battle between buyers and sellers over a given period of time. This can help traders to make a decision on whether the buyers or sellers have control.But, candlestick charts are best used in combination with other technical indicators such as support and resistance levels.